Hi spacefriends,
The Economic report for the month of July is now available for your viewing pleasure! The raw data can be downloaded by clicking on this link.
o7
Hi spacefriends,
The Economic report for the month of July is now available for your viewing pleasure! The raw data can be downloaded by clicking on this link.
o7
Tin foil hats for sale below Jita market price send your ISK and I send your Tin foil hats back right away. 
You mean “monthly plex advertisament report” right ccp ?
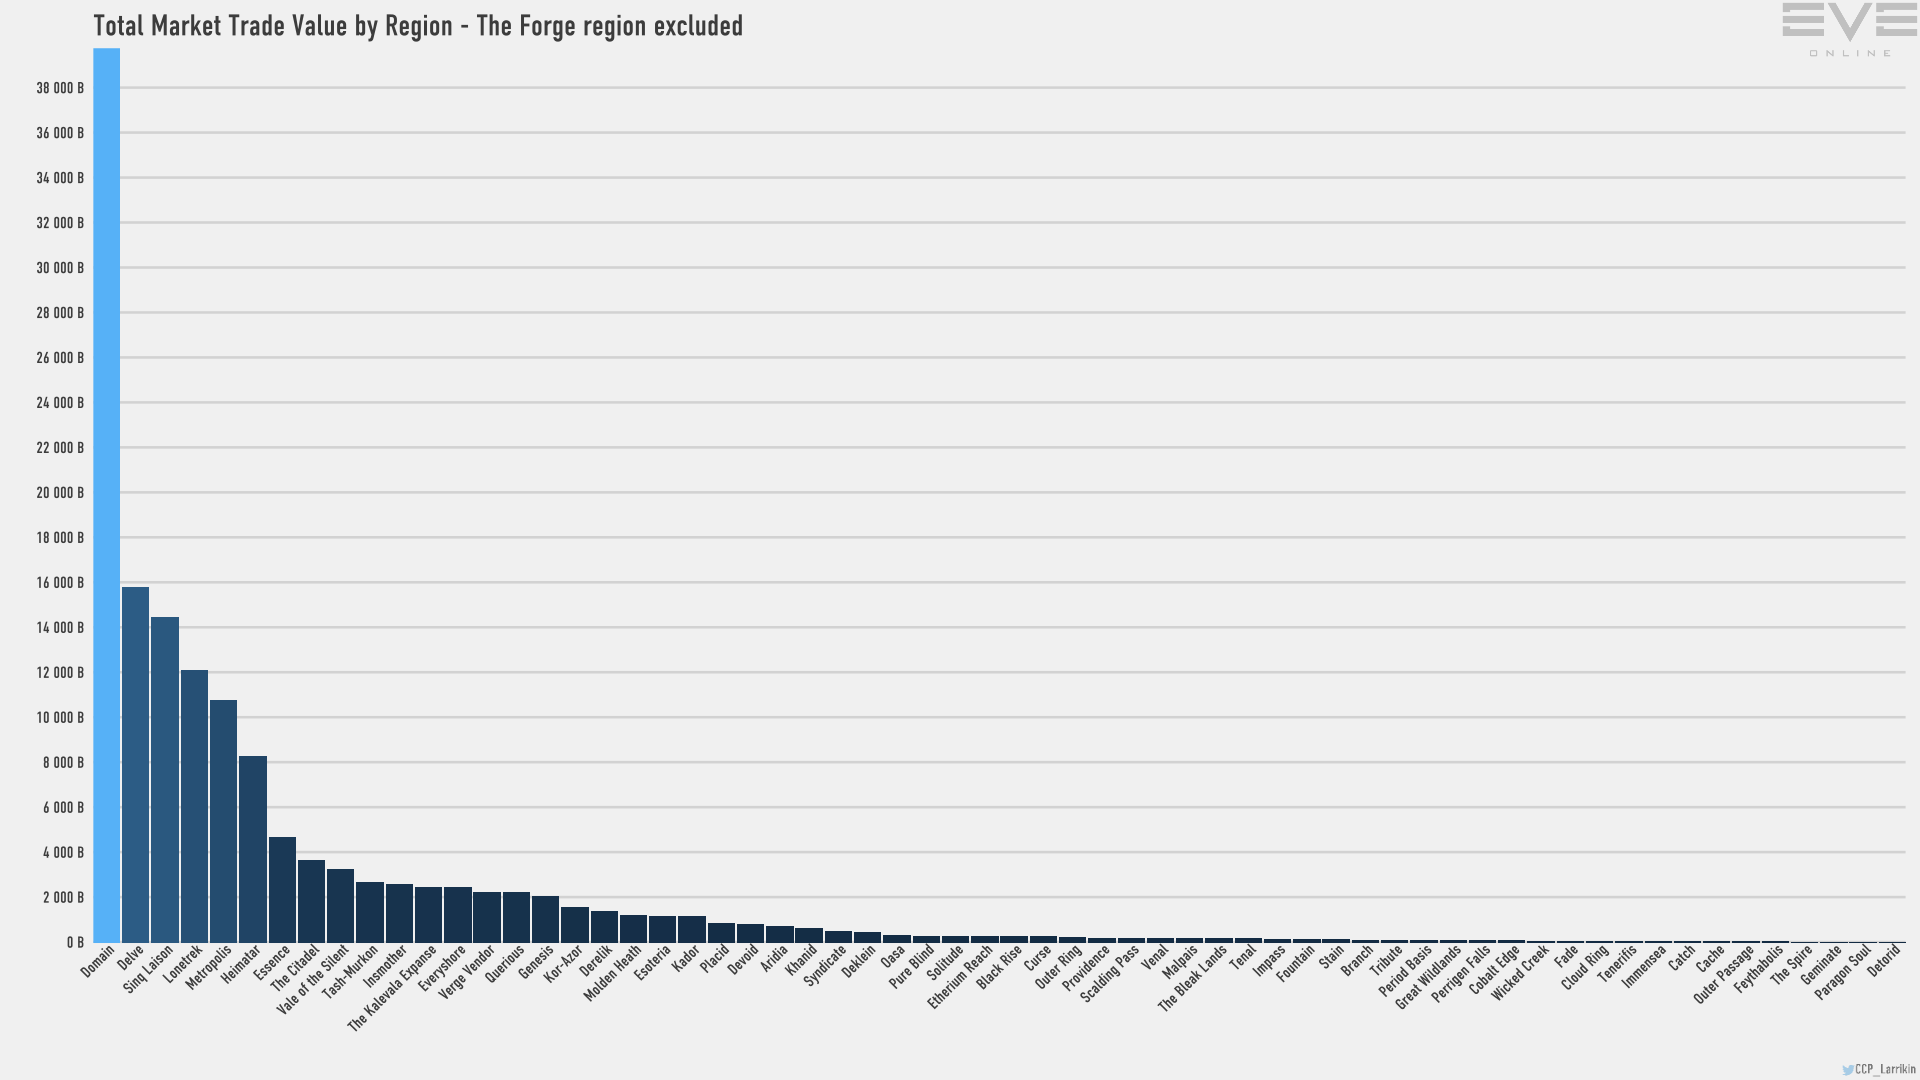
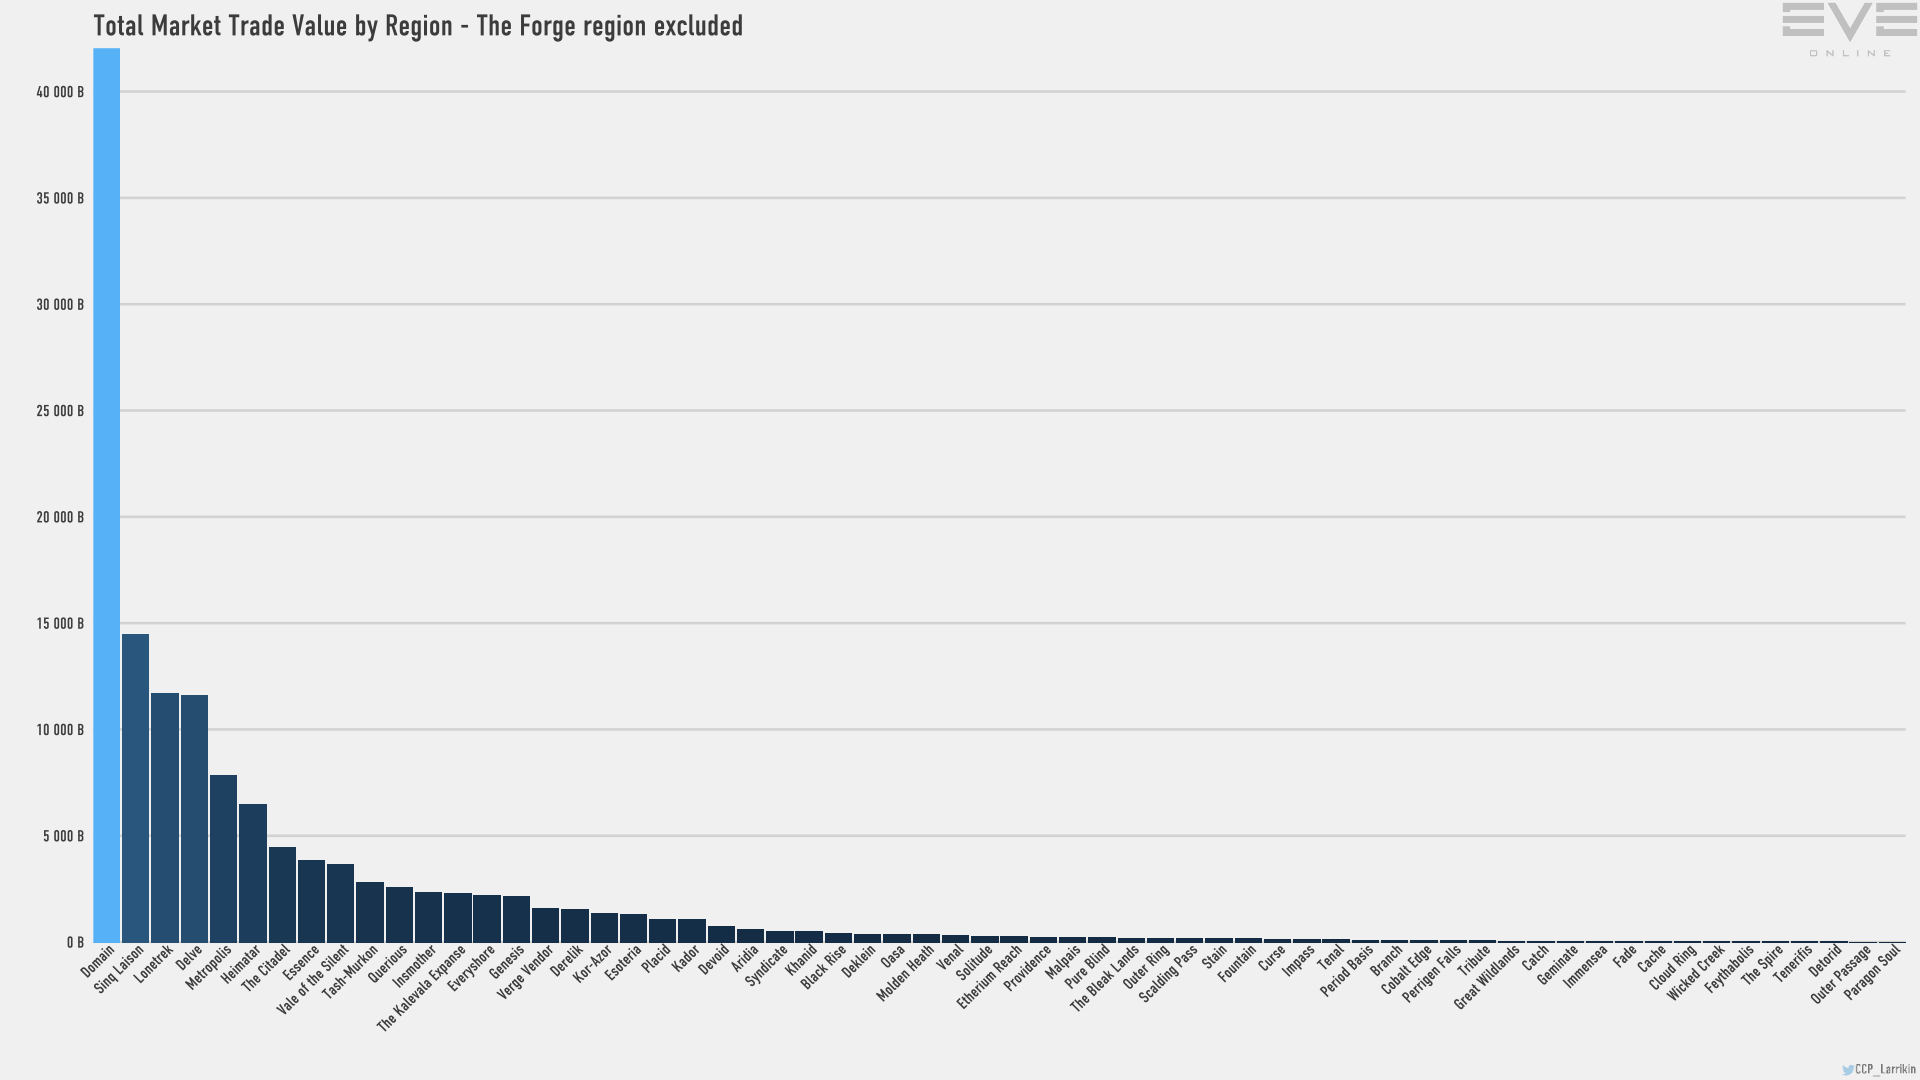
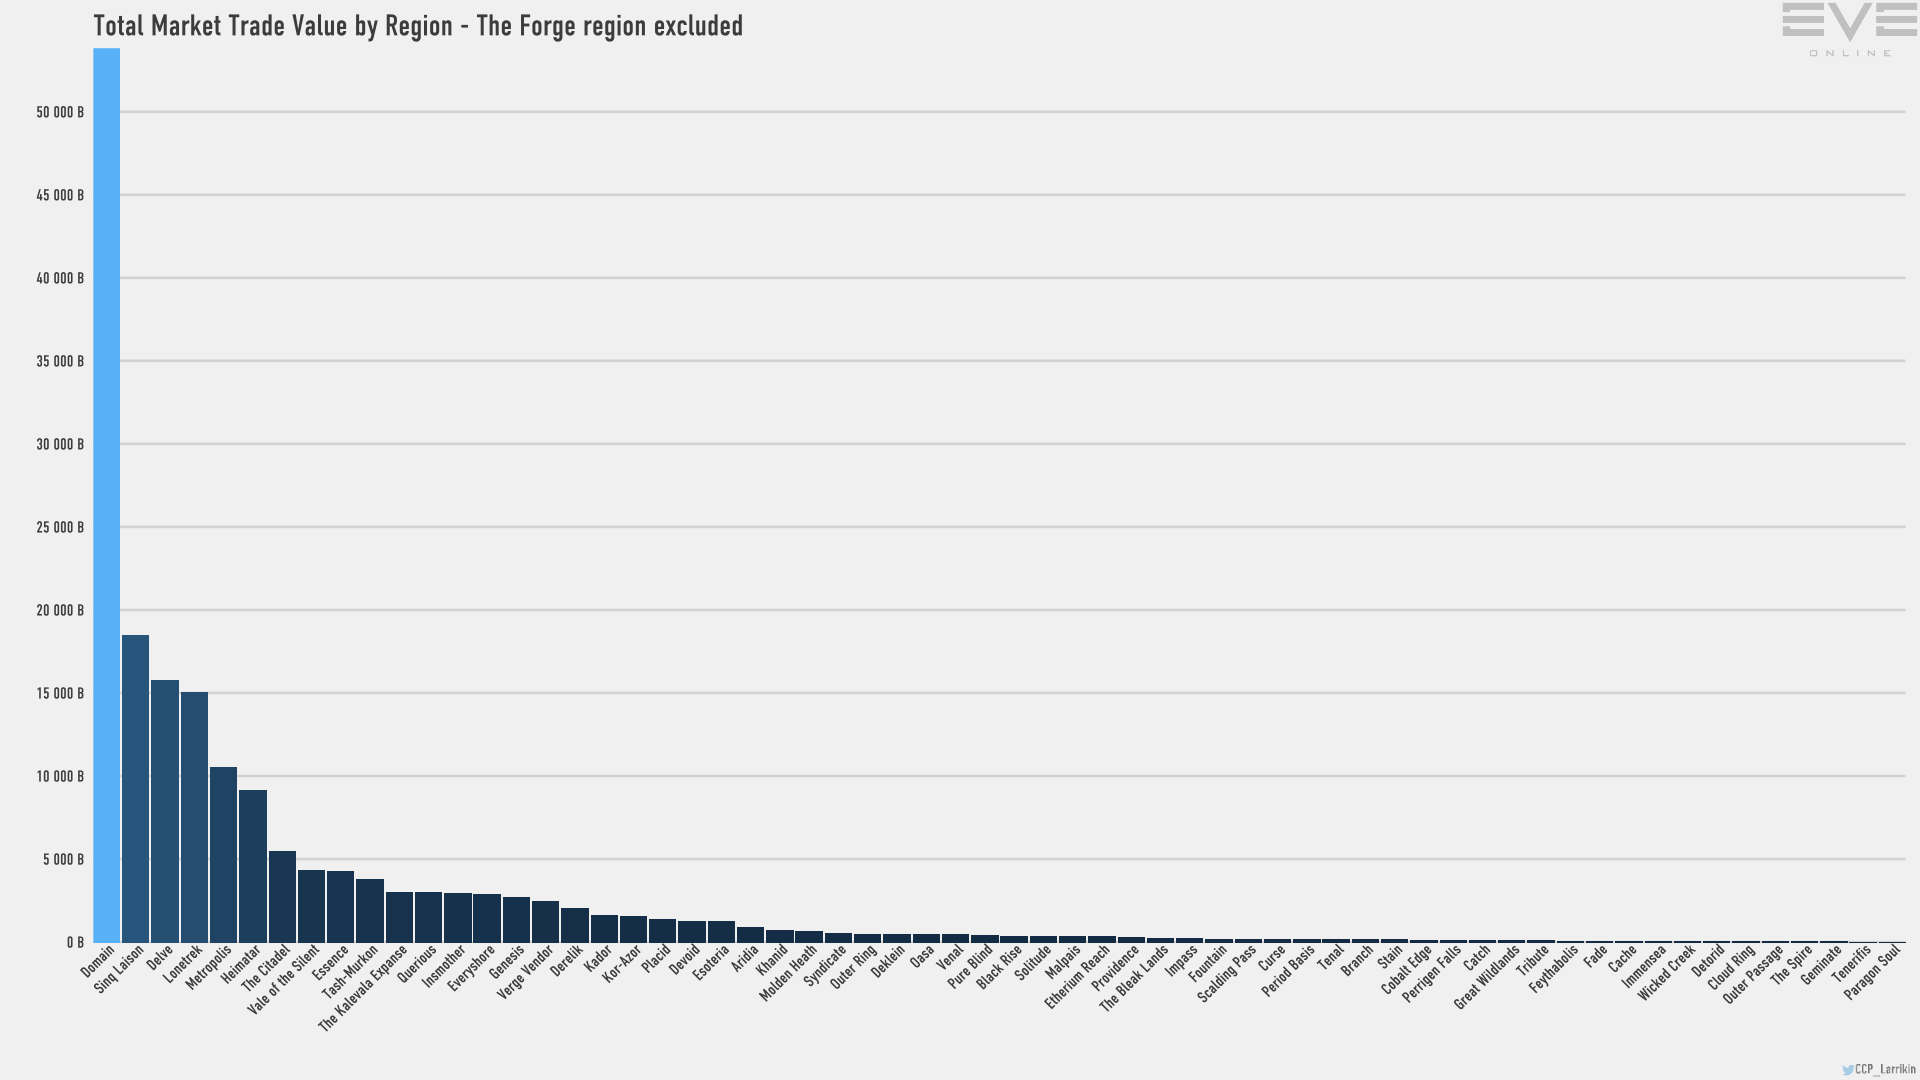
What the hell happened to the Domain market?  20T ISK trade value lost since May. I remember someone saying that Amarr is doing so well since Poochven happened.
The Blue Loot market and Commodities in general look great though. Risk free ISK printing is taking off.
And 3rd month in a row no Pochven @CCP_Fleebix i’ve mentioned this 3 months running now, any chance you can actually update the scripts that generate this data please?
Starting to get rather disappointed in CCP if they can’t even manage to properly report their own information 
Hey! I just want to say that, as a still somewhat new player and a IRL economist I find this really freaking cool that you are producing and publishing these. I’m sure that’s a lot of work, but I just want you to know this is awesome. Keep it up! o7
Sooo… Still no Pochven. It’s a region, right? Why isn’t it on the Regional stats?
Next… If we add up the daily numbers for July, the daily numbers for the whole report since July 1, and then all of the Regional Produced/Destroyed/Mined from RegionalStats.csv, we get the following totals for Regional P/D/M:

Also, showing my work.
Now, I’d expect, what with the whole 'Pochven isn’t here, Abyssal Deadspace isn’t here, and all 33 regions of WH-space aren’t here, that the RegionalStats.csv numbers should run well below the ‘End of July’ numbers. After all, that’s what the MER’s purporting to show, right? The numbers for July?
Except, obviously, they don’t. The Regional numbers, even with 35 regions missing show more production and destruction than the daily totals for July add up to. Only the ‘mining’ numbers display the kind of behavior you’d expect, if the Monthly Economic Report’s numbers are, you know, for the month.
What this means:
The numbers are still including the bleed-through into August. In fact, with the release on Aug 17, you’ve got data being included that goes right up to Aug 9. Why is this a problem?
Because it happens every month. And because it happens every month, every month is wrong.
In June, for example, the MER included the first eighteen days of July. That means everything from July 1 to July 18 has now been counted twice for the nice pretty graphics like this:
This is an image of 40 days of market activity.
This is an image of 49 days of market activity.
@Zhalyd_Lyehin: you want to know what happened to the Domain Market since May? Guess how many days of June show up on the ‘May’ MER…
19! So, with the slightly longer May, that’s 50 days of market activity on that graph!
Now, let’s keep in mind, that’s May, which is still before things hit the normal summer slump, and before a big chunk of people were vaccinated, so some decline in the summer has to be expected. But the fact that the ‘month’ was literally nearly two months long sure as hell didn’t hurt those numbers.
@CCP_Convict @CCP_Dopamine @CCP_Rattati I know you guys have been made aware of the bleed-through in the past. You literally work in a place with a bunch of computer programmers. Can you PLEASE just get someone to write a script that automatically runs during DT on the 1st of the month to collect these numbers?
Please?
And maybe include Pochven? Not even asking for j-space, though that’d definitely help on the production/destruction/mining end of things (not so much the bounties, obviously), but just Pochven?
As RL economist, what/s your analysis of these reports? The health of the New Eden economy?
I’m still too new to the game to have a proper understanding of all the game mechanics that are at play. But I find it quite fascinating to compare these reports over time, and especially to consider the repercussions of large conflict such as the war in the Delve. Beyond the sheer amount of destruction in the region, the impact on the overall economy beyond the region is very analog to real-life scenarios.
BTW, before anyone gets too excited over this graph…
I’d like to explain exactly what the massive uptick right at the end of July/early August is.
The Money Supply is basically ‘what’s in everyone’s wallet?’, and that ‘Character’ line responds to people going idle. If you’re not logged in for a month1, your ISK drops off the tracking. At the beginning of June, a number of the large nullsec alliances involved in their war of extermination against Goonswarm told their guys ‘hey, they’re contained, it’s all good, take the summer off’. Partly because of that, and partly because they realized that their leaders had no intention of actually trying to win the war, a lot of them did just that.
On Jul 23 or so, those same alliances issued a general ‘GET BACK TO THE GAME!’ call, announcing that everyone needed to get back to the staging system of T5ZI in the coming week, because the offensive was ON! According to progodlegend, that trustworthy CSM member, ‘give me four weeks and the war will be over’.
One week later, on August 2, the entire PAPI coalition collapsed, with each of the large alliances separately announcing that they’d be evacuating the theater of war. On Aug 2, line members were told there would be an orderly retreat over the next 3 weeks, and not to panic. By Aug 5, that had turned into ‘OH MY GOD EVERYONE GET THE HELL OUT NOW WE CANNOT GUARANTEE YOU WILL NOT DIE IF YOU DON’T EVAC ASAP!!!’
And that, my friends, is why you see a 75 trillion ISK uptick in the money supply, as people who hadn’t logged in suddenly scrambled to get out before their staging keepstar died (Which it did only 11 days after the ‘you’ve got 3 weeks to move out’ announcement).
Don’t look at that uptick as any kind of actual economic indicator. The downturn is people in PAPI slowly drifting off, and the uptick is them scrambling to login and get their suitcase caps/supers out.
1. CCP claims the lag time is 3 months, but INN’s published pretty compelling indicators that it’s only one. I know, I know, CCP not understanding their own tools?!? Shocking, right?
It’s not straight forward to interpret the information using real life knowledge. Whilst many of the rules of the economy are the same, the setting, or conditions, are entirely different.
A ‘healthy’ economy in the game is not the same as a ‘healthy’ economy in real life.
And a lot of the information needed to understand it just isn’t presented in the MER.
It looks like they messed up the Net Imports. No way did Heimatar have 14 trillion ISK worth of imported goods.
Keep in mind, that also includes the net value of ships, including capitals, into the lowsec heimatar systems during the Amarr FW offensive. Those assets haven’t been pushed back out yet, and considering the way the price of capitals has jumped since the last industry pass…
Wow good spot. If the data bleeds through leading to it being counted twice, that’s pretty shocking. Does that impact faucets/sink data too? That would be pretty wild if so as entire narratives and design approaches have been positioned around the ISK supply.
How about adding players in each region. Broken down by timezone. So I can find some fkn content
all i know is that i got free isk for a week on all my accounts.
Well, they also gave out 235mil isk to each omega account. So, that had to have accounted for a a good chunk of the increase in the money supply as well.
On the plus side, destruction and production both saw small bumps. So, maybe things are starting to turn around. Guess we’ll find out.

Remember that it only gets counted twice on the total sheets. The day-by-day line graphs, like this:
don’t have that problem, because obviously, they track each day, and so each day only gets counted on that day.
Nah. They gave out 235 million to each omega that logged in every day during that event. In order for that to amount to even 1 trillion of the 75, that’d need to be 5,000 accounts. So, no, I don’t think it likely accounts for a good chunk of what we see. At most, maybe 1.5-2t.