We’re continuing iterations on the MER with a few notable changes. Pochven has been added to every regional metric. Net Imports and Net Exports have been merged into a single graph and the Decomposition of Trade Value in each group is not a part of this update and is being phased out.
On the latter part, we would appreciate your feedback on the removal of Decomposition of Trade Value graph.
We have bar versions coming soon™ (Hopefully next MER) for the regional graphs.
You can find the link to download the raw data for your spreadsheet fantasies here.
Just making sure I understand it, trade balance is recorded by total ISK of goods sold within a region, minus total ISK of goods purchased within that region? So, it is an approximation, as the services and other economic goods cleared on the market are recorded? Just trying to get the best idea of how Tash-Murkon is so high, and Domain so negative.
Ore mined is still not up. Where’s the Up in ore mined that Swirft talked about?
Prod is up, other mined things are up, but destruction is flat-lining. How about some data on who really gets ESS money, attackers or sov holders.
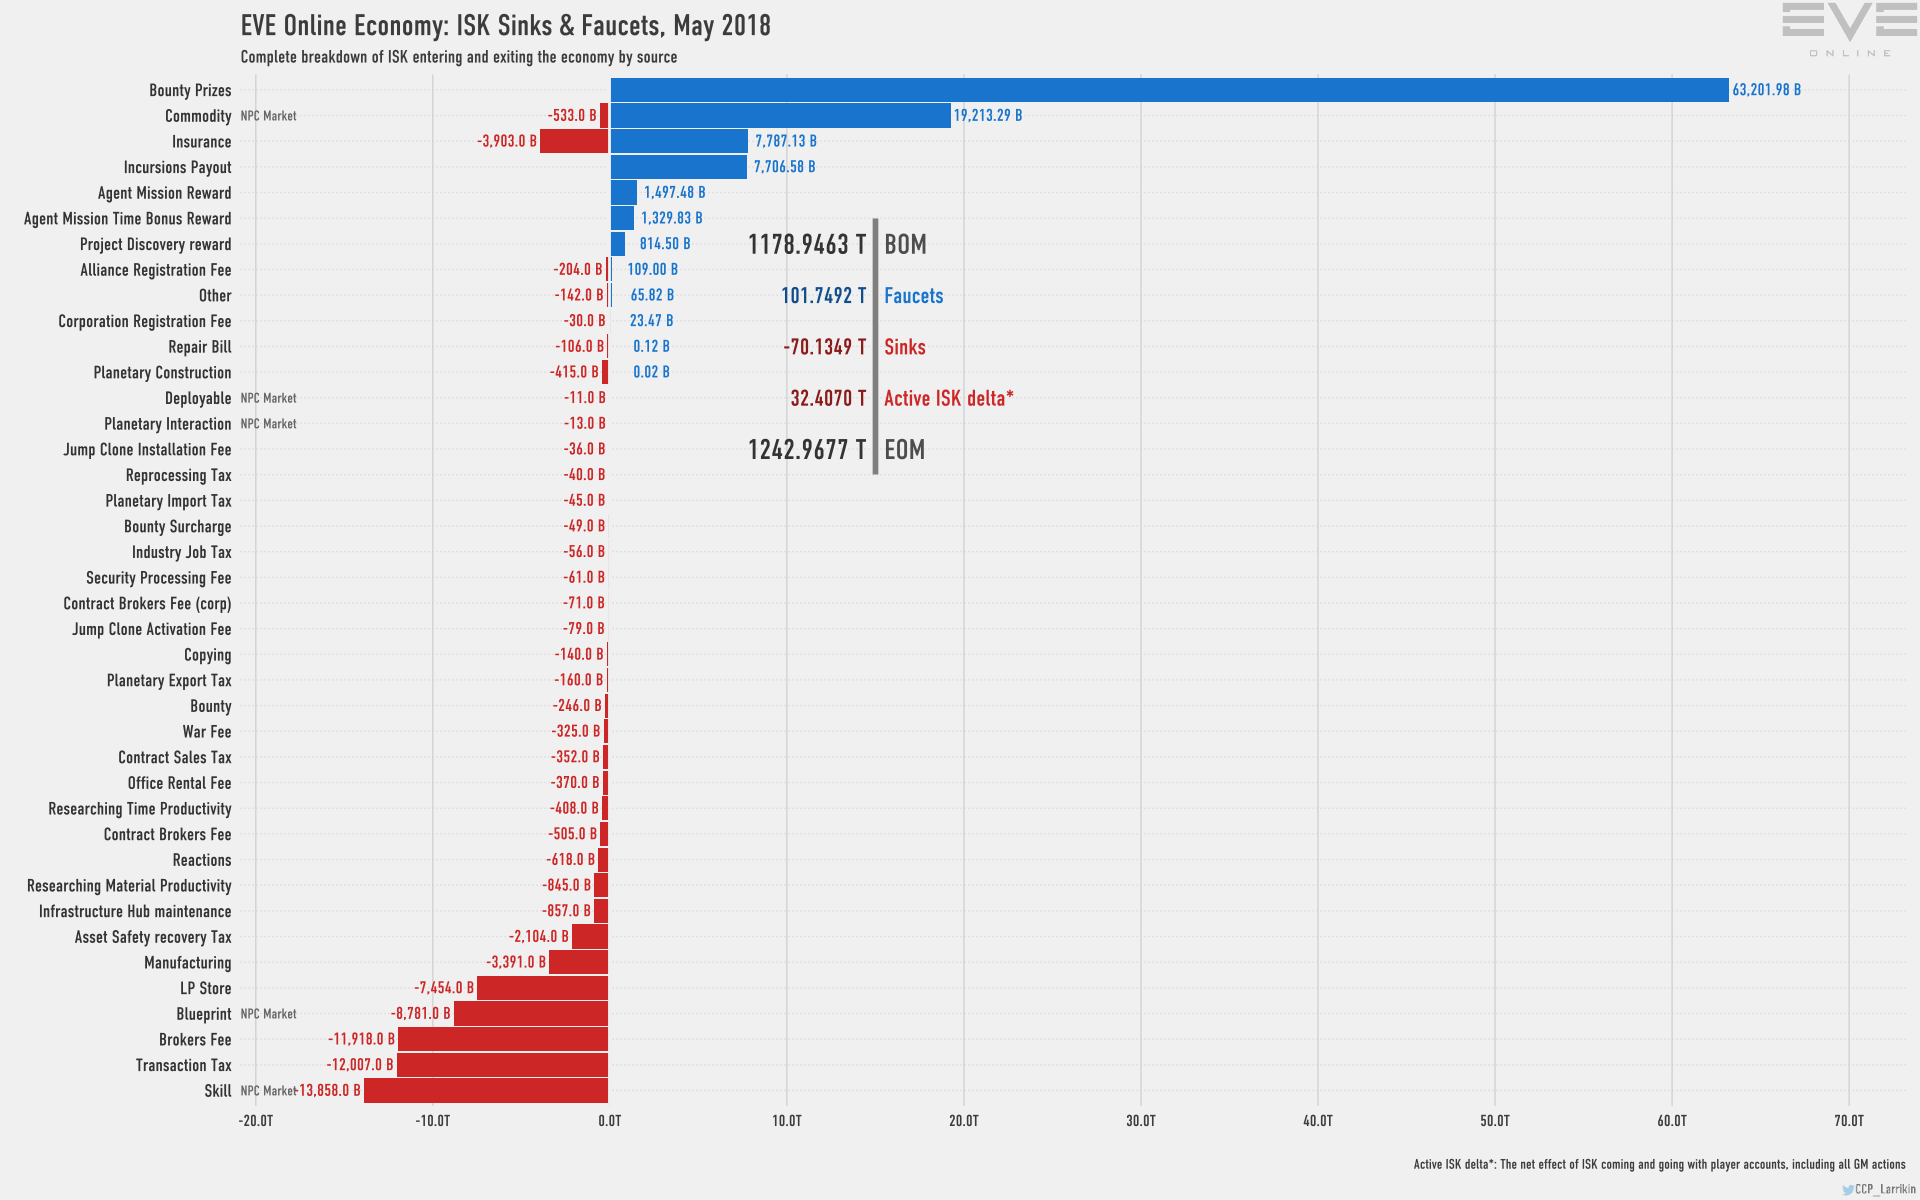
And the commodities faucets are still going completely bonkers.
Remember when this level of faucet income was complained about when it came from bounties? Before someone says “But Commodities are higher risk because you have to transport them”: How much risk do they really experience? How many farmed commodities really get lost to PVP or otherwise to justify this argument?
Why we don’t see wormhole regions in gas volume despite more than half of whole gas are coming from wormholes according to gas mined over time ?
p.s. consistent trend of ISK velocity makes me worry about the economy
Moon and Ice are up a lot, Asteroid and Gas close to flat but technically up… I mean overall that is up not sure if you were wanting to see something different? everything seems to be healthier even with waste as far as m3 numbers are reflecting.
Moon is only up because of increased availability, ice is also only up because of increased availability, not because of ship changes. People have been mining those like crazy even before the ship changes.
Astroid ore is not up despite increased availability, but Swift said it was up a lot. That’s what I expect to see. Otherwise the whole argument that the ship changes improved anything crumbles like a house of cards.
Oh wow, okay didn’t know you had that kind of insider information. Wrote it in my book of notes, only increased because of resource balance, not ship changes.
Let me see if I can’t get those three graphs for January for you guys.
We removed these three graphs as we feel it wasn’t giving enough value in the way it was being represented. It was more artwork than good data visualization.
That being said we are planning on adding those back into the next MER with a new and better version.
You mean that he talked about for last month’s MER? It’s on last month’s MER, and yes, Ore mined is up over literally the day before the December patch, which is what he was talking about. Like I said in that thread: Swift’s a lawyer. He’s gonna lawyer. parse his words very carefully, because he’ll be perfectly honest… in an obfuscating way.