I’ve been passing time while mining with Project Discovery. It’s pretty fun, but there seems to be a lot of poorly made accuracy tests. One has two sets of dips that have the same period but are out of phase. How are you supposed to know which set to ignore? I marked them both, but only one was “correct”.
There are also several that mark indistinguishable noise as transits.
Is someone looking at the failure rates on the “known” transits to maybe fire the grad student who wasn’t paying attention when the automation threw up preliminary samples?
Most of what I can find through Google is from 2-year-old forum posts making the same complaints about the same “failed” analyses that I’m getting.
Some of the sample tests were done using more sophisticated tools.
Don’t stress it, you still get rewards and they are far enough between you will get to max accuracy anyway over time.
Looked at the sample picture it’s pretty BS that marking the center of the transit doesn’t count and it wants you to mark the side of it. Somebody goofed somewhere. Obviously they should have moved the transit mark some to the left. Honestly they should have doubled the size of it so it includes the entire transit. Just know you did right and even getting 50% of the slide right means you at least don’t loose any accuracy.
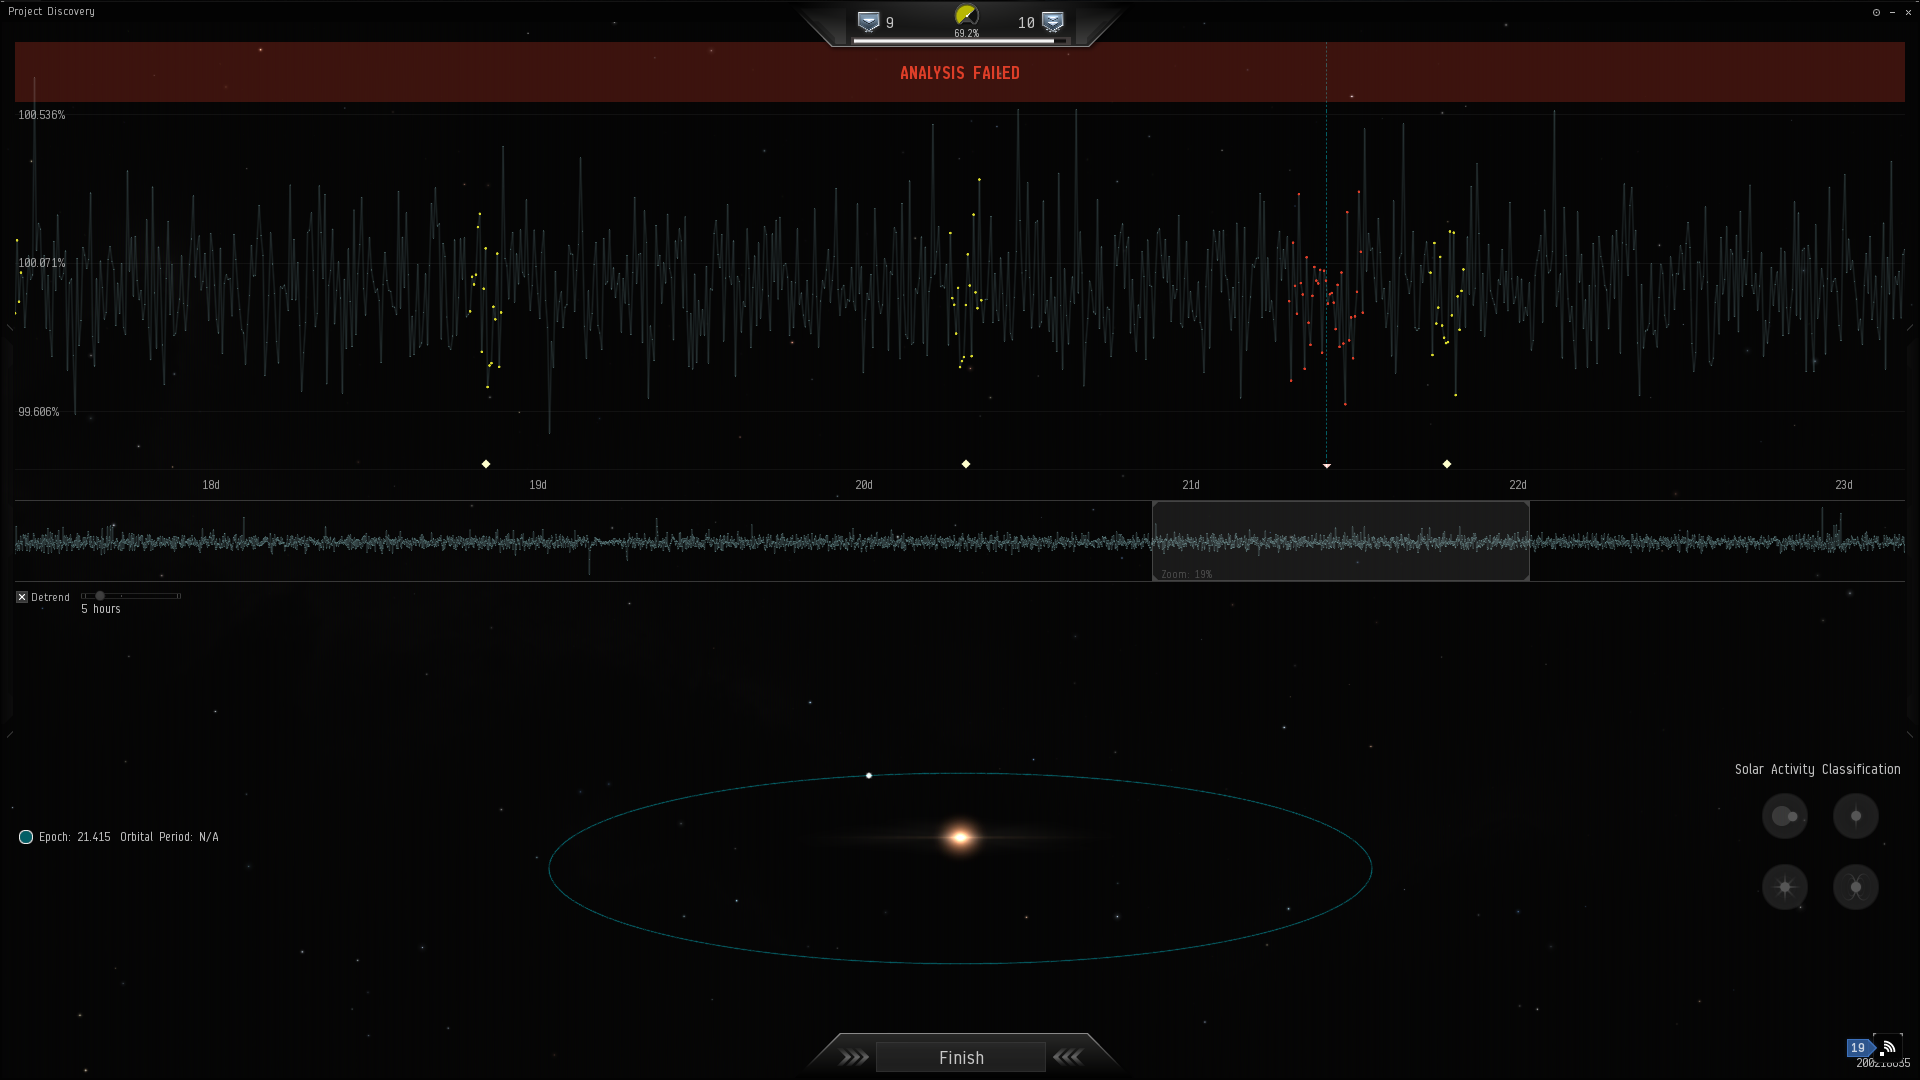
I get partial credit? Because all I see is “ANALYSIS FAILED.”
Doubling the size of this transit wouldn’t have worked. If you look carefully, adjacent transits are slightly closer on one side than the other. It looks like two planets with the same orbit but not quite perfectly opposite each other. Maybe the key was marked as a single transit, and that’s why half of them are misaligned on the side.
Here’s another one, which shows me why every single consensus sample has 10-20% transits marked:
I feel like you’re training people to 1) see transits in every sample, and 2) get really good at memorizing the answer key for the accuracy tests. Like I said, I think the failure rate on this sample and the trend as levels increase would be interesting, and not necessarily good.
If you have some “green” marks - it counts as a partial success despite the overall result of “failure” and accuracy change depends on ratio between correct marks to incorrect ones. The ISK and exp rewards are always paid in full and depend on accuracy rating.
You are the one in the fault for this one. And detrend 5 hours can make it hard to see patterns if any.
What I marked was the only thing that looked like a dip at any setting. I could have spent an hour meticulously combing the sample for the slightest dips, repeatedly marking and then sweeping the period markers looking for patterns and still found nothing. I have a hard time believing this one was found without more sophisticated tools.
you can skip these if you are not confident. Its kinda cheesy, but if you close Project discovery window and reopen it - you’ll get offered a new sample without any negative consequences (other than if you do it too often there will be a short timeout for next one and you’ll have to wait).
On item 1, it is just barely possible to make out a slight downward trend when folded. I would argue it is only possible because of the highlighting; without I would probably select the dip just right of center as being a transit. I might have selected the dip in day 24, but the transits in days 22 & 26 are noise. Aligning on days 24 & 20 would probably have gotten half-credit for that body. With item 2, there is nothing in the fold to indicate anything significant at any setting. The only “transit” that even remotely looks like one is in day 19; everything else looks like noise. Looking at the PEAK where item 2 “transits” on day 25, I wonder how I can take this seriously.
I’m only trying to provide feedback. I’ve been doing this because it’s a neat puzzle and the science is interesting. I’m just a bit concerned that some biases have not been accounted for and the science will be poorly served. Seeing this sample a few times will not make me a better analyst; it will make me better at recognizing this sample to pass the test, and more likely to mark noise as single transits in consensus samples.
I’ve done the tutorial again. I’m probably meant to fail number seven, but it would be a lot easier if there was a way to zoom on the y-axis so those blasted peaks don’t squash the dips into the noise floor. I found several likely dips, but because of a dozen or so tall peaks in the sample, folding was useless unless I was very lucky.
I sometimes have the same problem zooming in on the unfolded sample. I scroll along and suddenly, an outlier comes on the graph and all the subtle contours become a solid bar. For those, it’s usually as simple as scrolling back or past the peak/trough.
It would also be nice to be able to zoom in the x-axis when folding something with a period on the order of ten days. A dip lasting only a few hours is only about ten pixels wide when there are over five days to either side of the center. It can be hard to tell there’s a dip at all, much less select the center of it.
I participate in Planet Hunters project so I can notice that algorithm which generates accuracy tasks is bad. Eclipsing binary system shouldn’t be marked as transits but accuracy test demands it. You can easily recognize eclipsing binary, it looks like the first image in this topic but the depth of even and odd dips is different because stars have different sizes, luminosity and temperature but all dips have the same period.
And Project Discovery lacks some data like star size or it’s temperature, without this data it is very difficult to find transits. For example, if star has 165 solar radii it is obvious that any dip on a graph is not a transit. For some people might be useful object coordinates because it is very possible that a graph has contamination from nearby light sources and suspicious dips should not be marked as transits.