Monthly Economic Report - June 2022

Hello everyone,

It is bright and early in July and with it comes the June Monthly Economic Report. We are continuing to improve on the MER in various ways and starting this month, we aim to deliver the MER no later than the first few business days of each month.

Additionally you can now access the brand new Dark Mode by downloading the full data here.

Enjoy o7

4 Likes

Destroyed and Produced going down. Good to see. And save Poochven is cannibalizing more and more destruction away from other areas of space. Great.

How about we finally get a Lightbox for the pictures so that we don’t have to open them in a new tab any more? You know, like the lightbox that the FORUM has.

REDNES

1 Like

Incursion payouts fell off a cliff?

It’s just a summer

/s

It’s so astonishing that there are no official statements from CCP about the state of affairs in this.

3 Likes

I wouldn’t say we are cannibalising destruction from other regions we are just a far more stable region in terms of conflict, we also destroyed 80b less than last month (we expected it to be even lower than this thanks to doctrine changes of many krab fleets)

THIS IS TOTALI FINE WORKING AS INTENDED!!!

BTW WHAT HAPPEN WHEN PEOPLE STOP PRODUCING STUFF WHEN THERE IS NOT ENOUGHT PEOPLE DOING SUPPLY CHAIN :slight_smile: SELL SHIPS FOR REAL MONEY?

ALUMINIUM HEADS UP

2 Likes

It appears the Siege Green changes, making it easier to destroy medium structures, has not amounted to enough to cause a spike in overall destruction. Which trends downward, tracking the annual summer slump. June/July/August: when players start looking out the window, instead of at their computer screens.

When Citadels were introduced, CCP told us how many existed, to celebrate their adoption: please report these numbers again! Quoting from last month, I’d like to see the following statistic: how many medium structures are owned by the top 10 alliances, as a percentage of ALL medium structures.

Did Siege Green cause a one-month “gold rush”? Or does the pain for small-group medium structure owners, and a shift to “big blocks” for protection, significantly continue?

what a pathertic risk-reward ballance

1 Like

I think you have the totals on the wrong columns.

Was just looking at this as well. Def think it’s mislabeled.

Hi @CCP_Paragon , can I get your wonderful Data Person to compile graphs on what way each Navy & Pirate Ship is being conjured into existence?
You can either find BPCs from wrecks in escalations etc. or buy BPC’s from the LP shop and from there build the Pirate/Navy Ship.
Or you can directly redeem a Faction/Navy Ship from the LP Store directly.
It would be very interesting to see how that changed since the Industry Changes.

1 Like

An MER on the first of the month? WHAT SORCERY IS THIS?!?!?

(Serously, good job, guys.)

3 Likes

bullcrap the system is dying.

It’s not dying. the additional steps added into the manufacture has changed things, substantially. The number of mfr slots needed to manufacture large amounts of the new mid-components means that more chars are needed to keep pace… not bad in theory, but the goal of moving production out of super-safe areas (NS, HS) by large groups into more spread out around the eve universe has largely backfired – and rose up the costs and profit margins of those larger groups as it more effectively removes the ability of smaller groups to compete with them.

So you are saying buff low sec :stuck_out_tongue: and then balance will be restored.

If you mean the original set of changes that have since been partially rolled back, yes. However, one of the critical combinations of things to look at is the ISK supply and ISK velocity.

July saw the ISK supply start to contract again. This might be a short-term contraction in response to the price increases, or it might not. All of the contraction was on the ‘ISK in character wallets’ end, not in corporate/alliance wallets. So the ISK we’re losing from the system is ISK that should be active in the market.

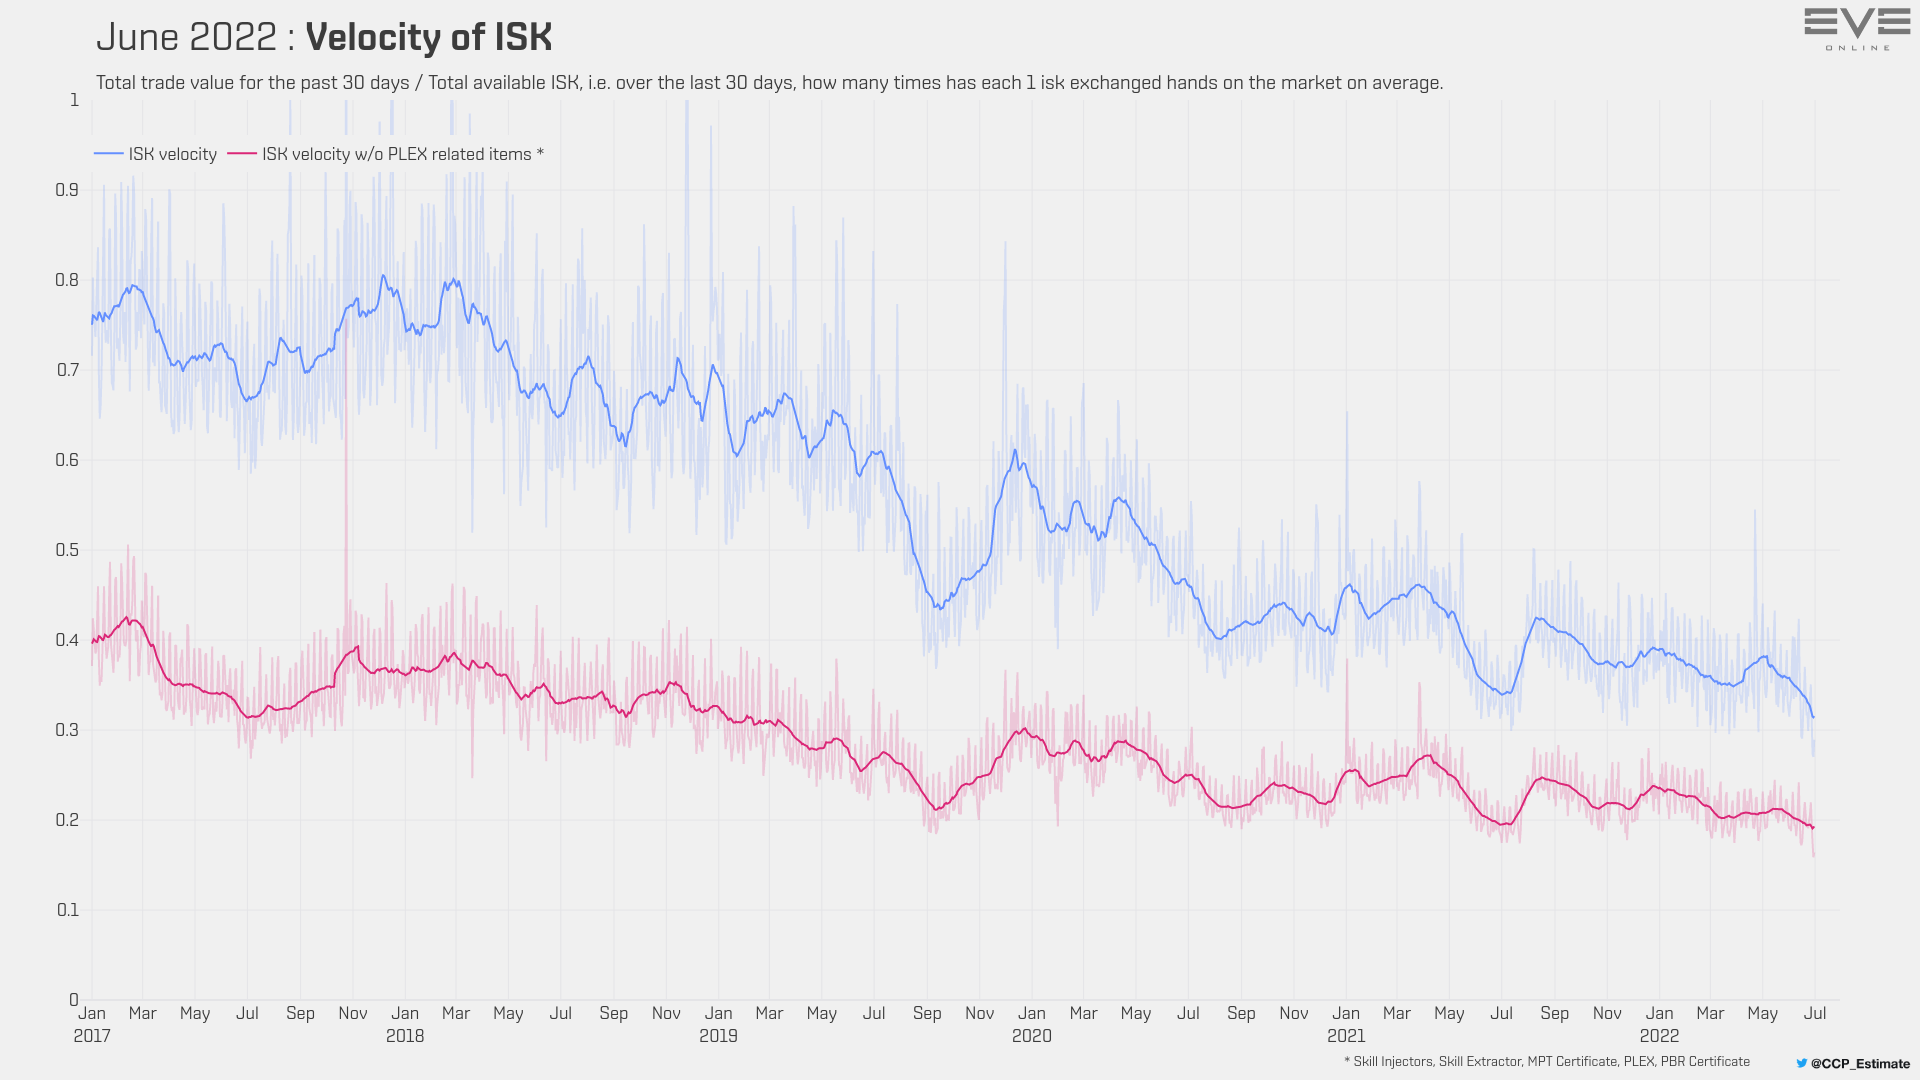
Looking at ISK velocity, we saw the ISK velocity including PLEX-related items… well, fall off a damned cliff. By looking at ‘money_velocity.html’ in the zipfile, we can actually pinpoint exact numbers. The recent ‘high’ plateau came on May 5-6, with each ISK in the system changing hands ~0.3819 per day. For the record, the post-Blackout, Pre-Scarcity Christmas 2019 peak (just a hair before the beginning of Jan 2020 on the chart) was right at 0.6 times per day, per ISK. A year before that, right around 0.7. So economic activity at that plateau per ISK is roughly half what it was 3.5 years ago.)

At the end of June, velocity is down to ~0.314 per day per ISK. It is on a slight uptick as of yesterday, though (going from 0.3139785 to 0.3153968 from Wed-Thurs), so maybe there’s some recovery in the offing, but right now, the picture’s pretty weak. Oh, and for those saying ‘well, it’s summer’… sure, summer’s playing into it. You see troughs in the Jun-Aug numbrs in 2017, 2018—wait, no, the numbers surged in Jul/Aug 2018… and in Jun/Jul 2019, before Blackout cratered them in September. 2020’s numbers were thrown off by basically all of nullsec shutting down the printing press for a bit to fail to evict Goonswarm, and then last year, the Imperium was under siege and PAPI had just told their people to ‘take the summer off and get away from EVE’… before cutting and running at the end of July, so I’m not sure just how reliable the 2021 numbers are for trends.

Bottom line, the ‘summer slump’ is as much a creation of confirmation bias as it is rational interpretation, so that can be largely set aside.

In the end, though, the loss of almost 20% of the remaining ISK velocity in 55 days… that’s not good. That’s not good at all.

8 Likes

This topic was automatically closed 90 days after the last reply. New replies are no longer allowed.