
Faction Warfare was introduced in June 2008. PvP activity stagnated until may 2012 when the inferno expansion reworked Faction Warfare. End of 2019, we are back to pre-inferno numbers. 2019 month numbers are half of their 2018 equivalent.
Warning : the Factional Warfare API gives stats according to FactionID.
This FactionID includes in the results the kills made by gate guns, mission/plex rats and faction navy/police. Gate guns are the “all time top ship” for all four FW factions… A rough estimate is that each “FactionID” gate guns get 300 kills each month. Mission/Plex rats impact is more difficult to evaluate because if they are side kicks of their own militia, the faction kill-mail is legit, if they help a pirate, it’s an abuse to say it’s a faction kill.
Factional Warfare, the place where even the API is broken. Dotlan FW stats using the same API has the same problem.
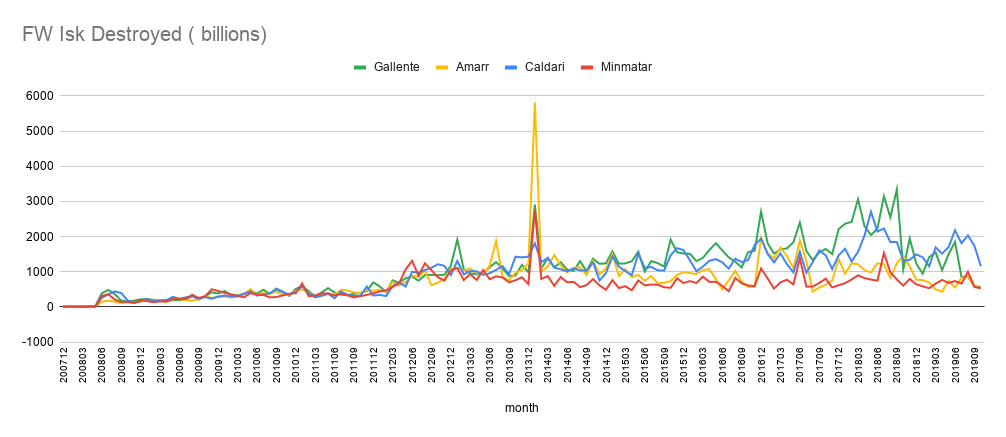
The January 2013 spike is the goon market manipulation exploit. At that time there wasn’t a limit to LP reward to killmails ( now capped). So goons cleverly began to manipulate the market value of some useless items to inflate the value of killmails and reap billions of LP. CCP then deleted all those ill gotten gains but those remained in the stats.
Interestingly even if the pvp activity goes down since years ago, the isk destruction doesn’t follow the same rate of decline. More on that later. The overall inflation in the game economy is also a factor to take into account with this type of economic graph.

Comparison between the Amarr/Minmatar warzone and the Gallente/Caldari one. Unsurprisingly the Gallente/Caldari has always been the most populated but both warzones follow the same trend suggesting that the downward spiral is linked to the general gameplay environment, not the specificities of each warzone leadership or geography.

All four factions stats merged in this graph. Again we find the 2013 spike and the overall decline. Since 2013, we lost 75% of the pvp activity.
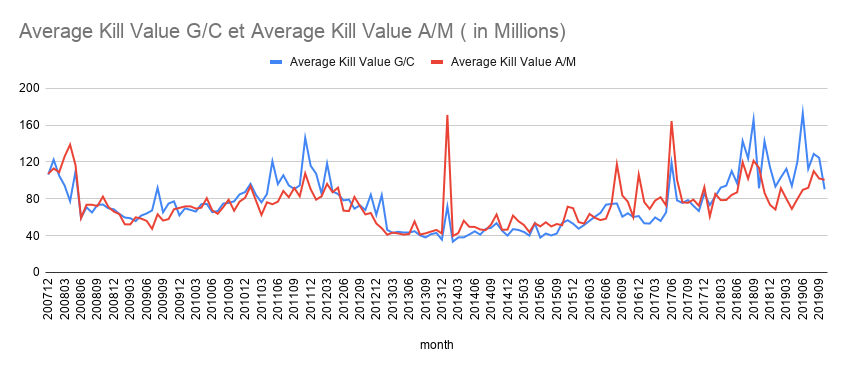
Average value of kill-mail each month for the two warzones. Both follow same trend with a sharp increase starting in 2016 when citadels were introduced : the meta switched from plex warfare and system/npc station control to a focus on Upwell structures.
Another explanation can be also the switch from swarms of T1 hulls oriented to win the attrition war to faction doctrines and overall better hulls thanks to the massive influx of LP allowed by the introduction of new hulls to run mission sites ( T3D in 2015 for instance).
The overall inflation in the game economy is also a factor to take into account with this type of economic graph.
Thanks for reading and for your support !
To participate to the effort of making Factional Warfare alive again : join the FW Discord !
Finally if someone has knowledge of a database somewhere with the history of victory points ( aka plexing), the LP produced or the Tier history, it would be awesome. The API only gives the current data not the historical data.