Based on other diagrams, all in game faucets are the same as previous 10 months. Its player origin, because Corporation wallet have smooth monotonous line. Just don’t tell me that somebody sold the Blue Loot for 100T ISK!
These are the bounties, faucets or ISK generators in game during the last 8th months, as I remember. Other market operations, even PLEX market, are ISK transferring from one player to another without any changes in total balance. Last month’s Bounty Prizes are a bit greater, but the Active ISK delta still the same as previous around 30-36T ISK, which can be counted as the main ISK influx into the game and inflation passive index.
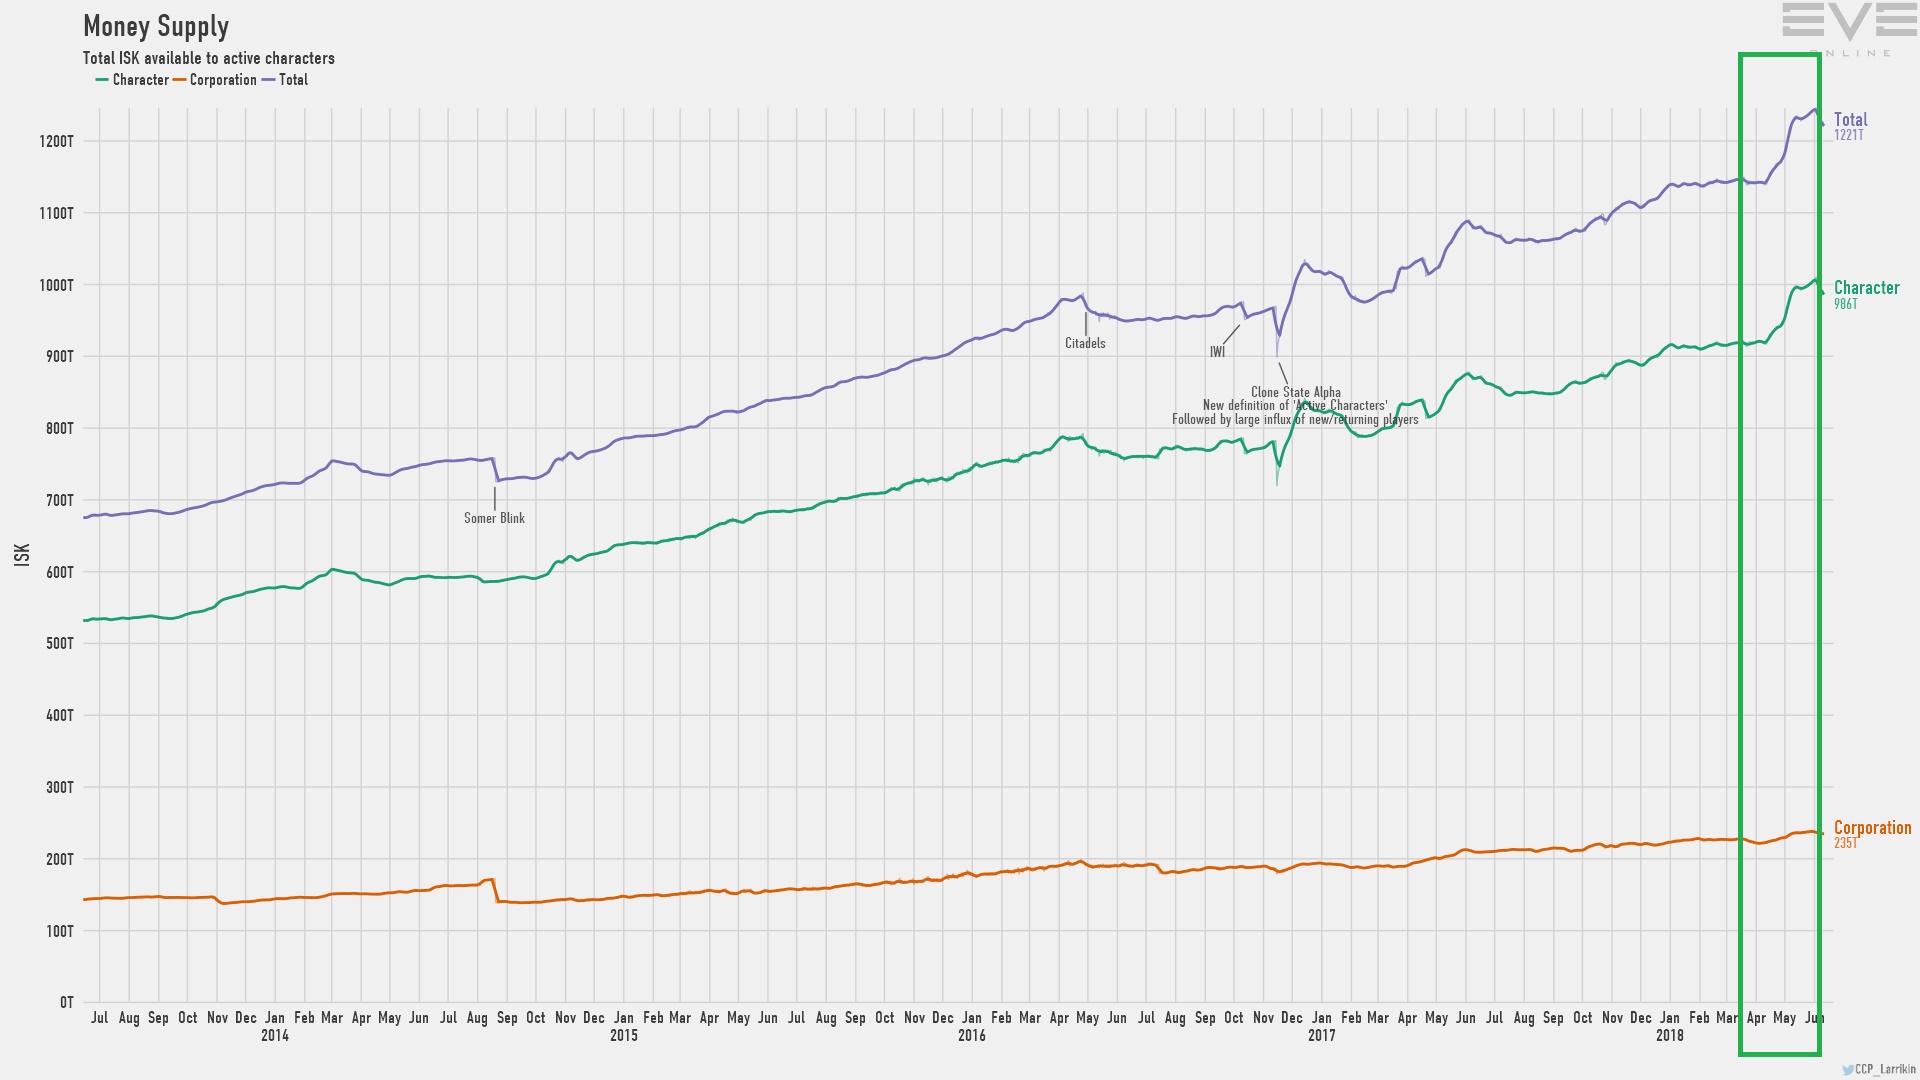
The curve would look like April/May in every month, if not for the “Active ISK Delta”, which is ISK leaving the game with player Accounts becoming inactive/banned vs. ISK becoming active again with returning players.
Normally this Delta is negative, meaning more ISK leaves the game with player Accounts becoming inactive than people resubbing and such. This is the only reason why we don’t have an extremely steep upwards curve of the Money Supply. (Which after some further conclusions, also tells that the devide between the rich and poor in EVE grows further and further apart). Look at the MERs for the past year, you’ll see what I mean.
So in April/May there was a significant amount of people becoming active again (resubbing or being unbanned, great enough for the Delta to be positive.
My best guess is Abyssal Deadspace brought people back, CSM elections may have been a minor influence as well.
Cleaned up the thread a little, 5 Messages deleted in regards to discussion of RMT and Exploits. Let’s also not pin The actions of a Few against a Race in RL.
But why could this be happening?
HMMMMMMMMmmmm
Could it be something big that happened a while ago. Something that could soon be a gigantic investment opportunity?
HMMMMMMMMMMMMMMmmmmm
Could it be that certain cartels have been preparing for months to have several trillion liquid ISK ready?
HMMMMMMMMMMMMMMMMMMMMmmmmmmmm
This is what I mean. I don’t understand well enough that “Active ISK delta (AID)”. I hope all those diagrams are correct and CCP publish trusted data to us. Since January many players were banned during this winter and spring. But the February AID is lower -30T ISK compared to this May AID 32.4T ISK. You posted that April ISK influx is based on returning and resubbing players. After all, since January the overall average online players is declining, which is a passive index of active players (resubbed, online, offline).
Based on the image above, the Apr online players are the same as Mar and May. Do you want to say that those unnoticed number of player brought into the game 100T ISK? If this is their balance then what are their Assets? Is this possible that somebody just activated a LOT of Omega ALTs (they don’t need to be online) to vote for CSM and to play around that Single Transferrable voting system method? Due to image above, the Abyssal didn’t brought so many people back online, and, in my opinion, people with that Wallet aren’t interested into Abyssal DED.
I don’t and I can’t figure what’s going on, because the May Active ISK delta is positive and average players online is lower than they were during winter season.
A transition from Serenity should have been announced by CCP and it should be represented with addition 5000 average players online at least and a very long DT.
When you look at the chart in the OP then one can see a similar increase for the previous year. So while it isn’t visible in the player numbers is there still the possibility of it be a recurring, seasonal cause. The value also seems to drop off afterwards, too.
By the way, is this the actual ISK value or is it a character’s total net worth, which is shown in the OP’s chart?
doubt it as they would be starting new accounts on TQ that wouldn’t have any isk, so any isk that shows up there would have to be through bounties and other normal means.
And with alpha clones they just need to be logged into, super easy to just hold isk on an inactive account, although I’m not sure its worth it I’d rather just keep my isk on my active accounts.
that would show up in bounties, afaik bounties have been pretty stable for a while looking at sinks/faucets over time the bounties have had some pretty big variation but in the 1.6-2.4 tril/day range for the last 18 months or so. We would see a pretty massive acceleration there if all that new isk was from bounties.
The curve shows the rise in overall ISK supply, which counts sinks, faucets and AID together.
If you look at any MER, you will always find ISK faucet being larger than ISK sinks. Look at the 3rd image in OPs post. Faucets roughly 101T and Sinks -69T, both of which are pretty normal and not surprising. “AID” in between them only counts ISK that has not be sunk, but for another reason is not counted as “active” anymore. In the past CCP explained that a negative AID could be due to bans or player accounts becoming “inactive”. What exactly the latter means in times of Alpha clones, I am not sure. My baseless assumption is that they count the wallets of accounts/corps who logged in during the given time period.
So half of the steep curve is actually “normal”, but the AID is untypical. I could very well imagine that the introduction of Abyssal Deadspace brought a lot of inactive players back into the game, even just to try it.
So basically this:
Which could also have a little bit to do with the CSM elections. Maybe some rich players purely came back (not necessarily resubbed) to vote, logged in once and are being counted for the AID.
A negative AID does not necessarily mean players being banned as far as I understood it, but I might be wrong. “Resubbing” was probably a wrong assumption on my side, unless they never counted any ISK on Alpha clones. Instead I assume that it simply means a player logged in during that time period.
Not sure how much these graphs really tell us. Do they count highest concurrent player per day or average concurrently logged in players per day? If so, how many times a day do they make a count? I have no way to back this up, but during April and March I had the feeling that more people were online for longer times. A decline in June is not really surprising: Europe had an early hot summer and players are usually humans, so some gals and guys decided to enjoy the thing called outside. Pretty normal for EVE.
You have to separate between ISK faucets - ISK sinks and AID. The 64T change in ISK supply for May needs to be read like this: 101T ISK Faucets, meaning people continued Super ratting, C5 farming etc. In the same time only 70T ISK were sunk (i.e. consumed) into all the stuff you see on the left side. Highly profitable Ratting alone is responsible for 32 of the 64T additional ISK at the end of the month.
The other 32T came back in Wallets of Players/Corporations who logged in during that month, but didn’t log in the month prior.
This is a more typical example. Actually ISK faucets - ISK sinks is very similar to April and May, just that in February we had an AID of nearly -30T ISK.
If a transition would have happened in April and May, players on Serenity would be incredibly poor. 32T being counted “active” again, because players logged in, who didnt log in the month prior is not much. 32T is much for a single player, but not much if a couple of hundred guys poked their heads back in.
Afaik it is only counting the ISK.
I think it is fair to guess that total asset worth could easily be more than ten times higher than ISK in game, maybe much more than that. On the other hand it would not make sense to count assets in ISK, because if players would try to exchange all assets into ISK at the same time, the prices would plummet as there simply can only be as much ISK as there is ISK. So from a logical standpoint, the overall asset worth in ISK cannot be higher than the overall ISK, even though it seems unlogical from an individual standpoint.
Edit: the latter also probably explains why CCP does not stop the high ISK faucets, because that would have a negative effect on anyone who sources or builds stuff, such as PI, Minerals, Modules etc. If the Money supply would drop but the amount of “stuff” (assets) would grow in the same time, all the things lose some ISK-value (while not their actual use-value for playing the game). As production has been greater than destruction of assets for a long time now, it is only logical that the money supply needs to grow.
So unless destruction rises dramatically, the only thing to argue about will be in which way ISK comes into the game and if the influx needs to be evened out, i.e. when super ratting is nerfed, something else needs to be buffed.
My idea to solve this dilemma was to introduce “decay of goods” into EVE, so that one item can’t be traded for infinite amounts of time.
In real life you have your regular overproduction crisis, because of ever rising efficiency and material wealth, which over time always leads to increasing drop of profit rates. Capitalism needs to keep itself afloat this way, with the negative consequence that inherently in these crisis it needs to impoverish people in order to create new ways to rise the rate of profit (temporarily until the next crisis).
Look at the price for PLEX over time and average ISK/h over time to get an idea how CCP handles it. (Apart from EVE having fundamental differences to the real world economy)
It is the active ISK delta. If you look at April the Active ISK delta is NA as is the net change in the ISK level. So for April it is shows a whopping 32 trillion increase in ISK.