Short story
If I count all wormhole regions, loot fairy slightly prefers to come every month. In some wormhole regions, loot fairy prefers to come every X days. But X is generally different for different regions.
Average of Regional Averages
|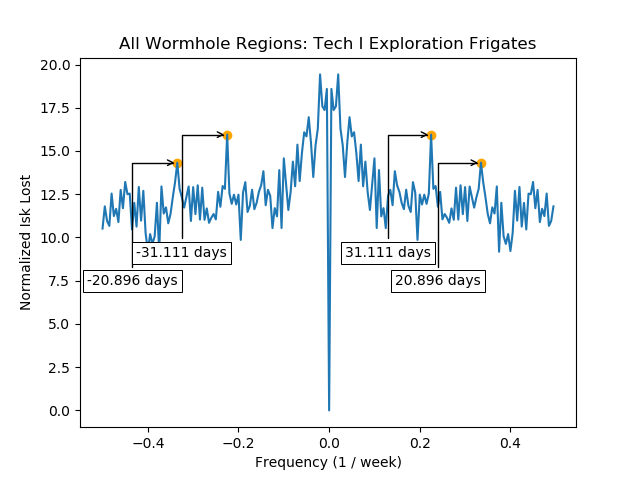
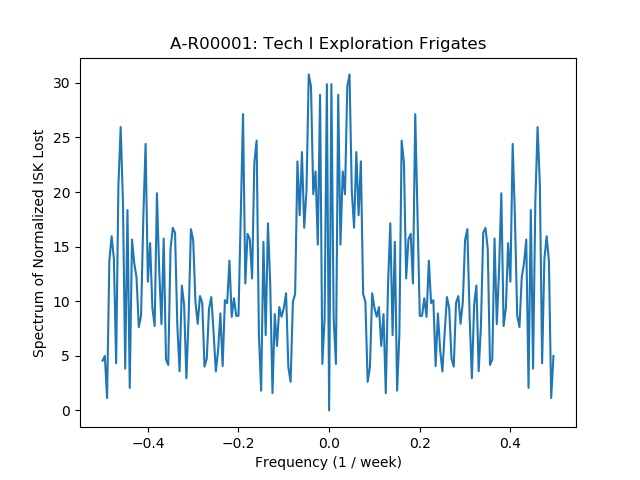
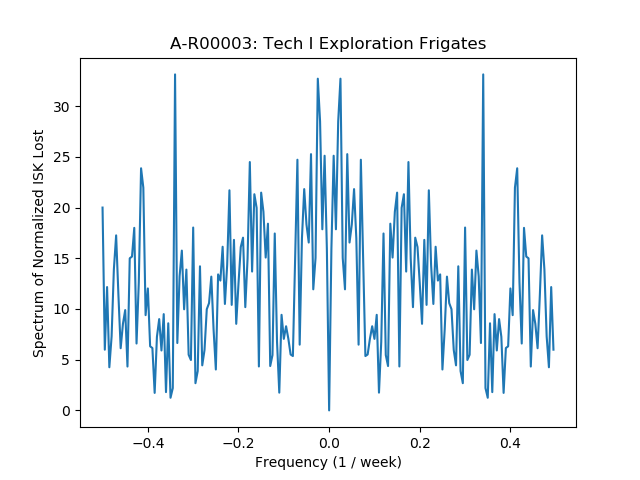
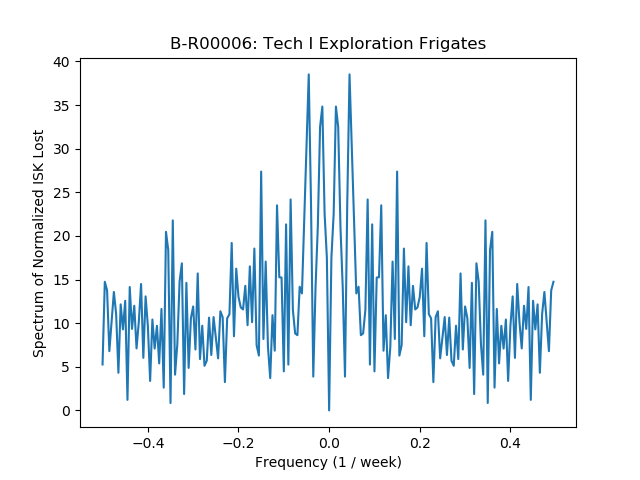
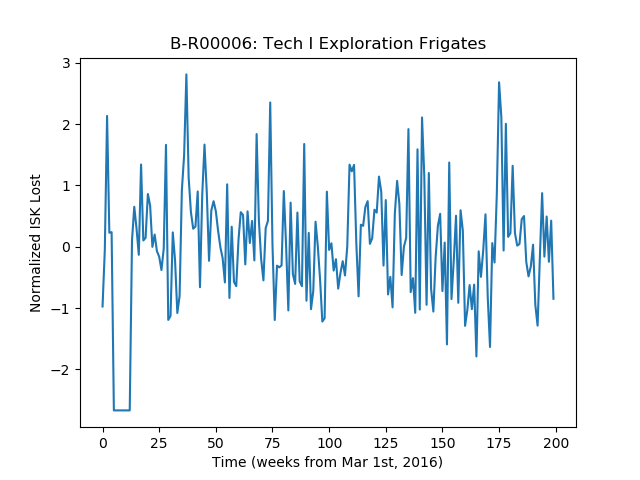
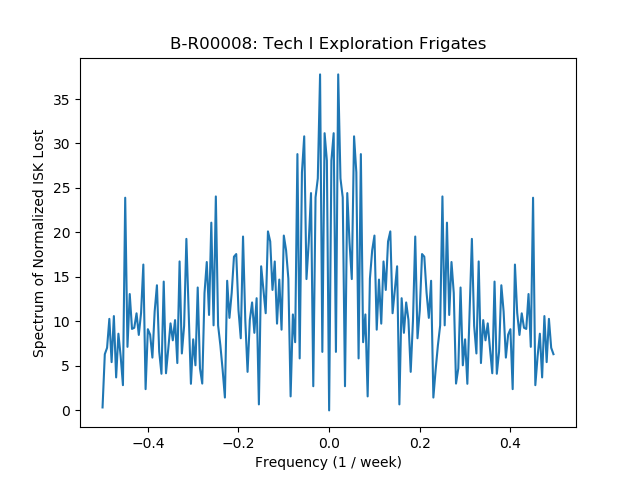
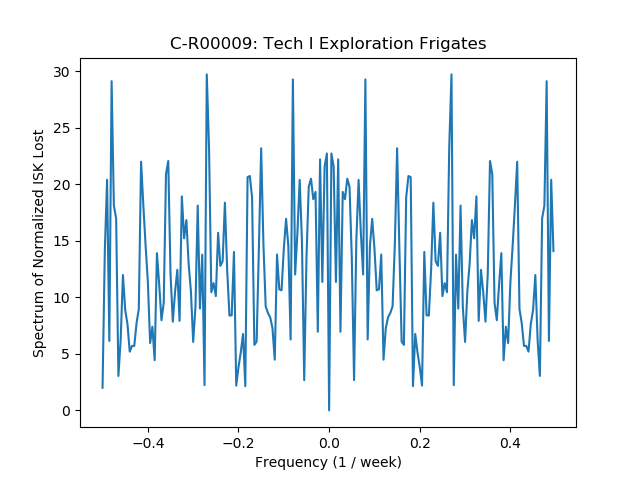
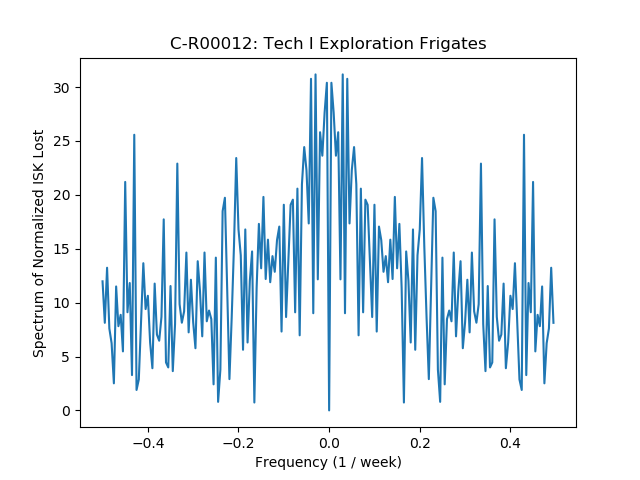
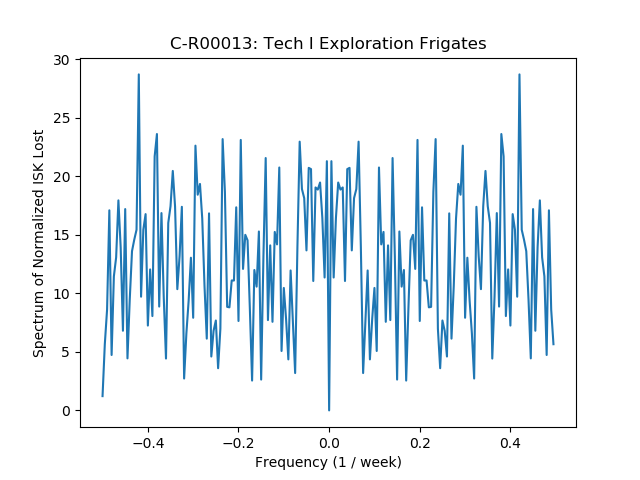
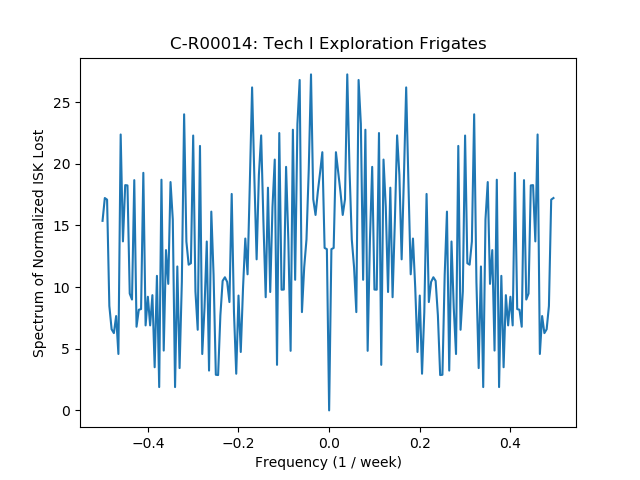
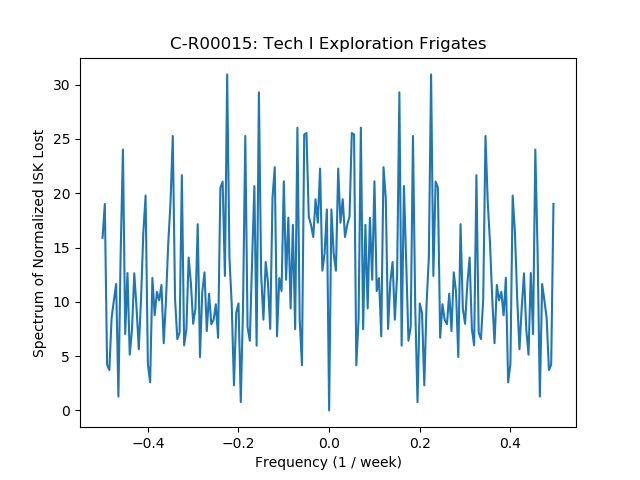
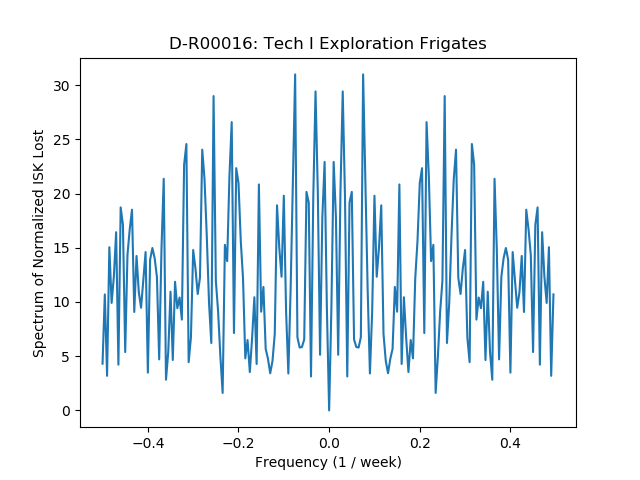
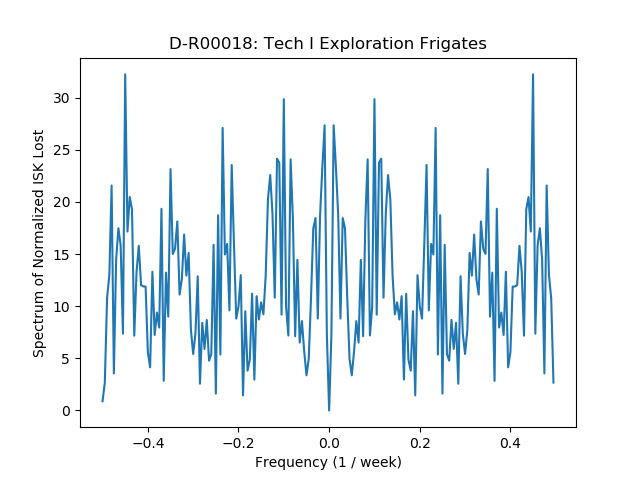
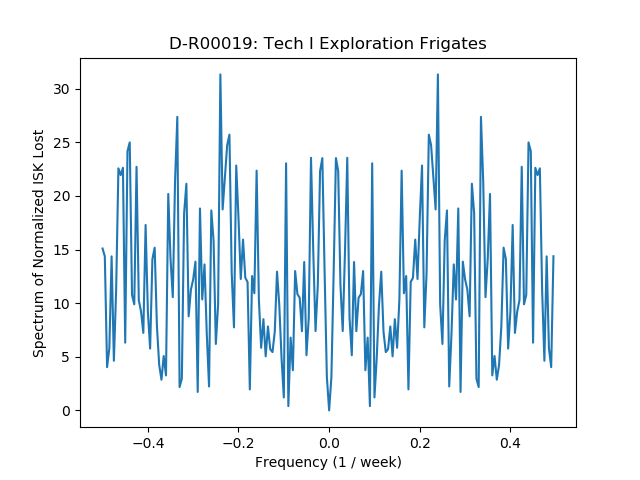
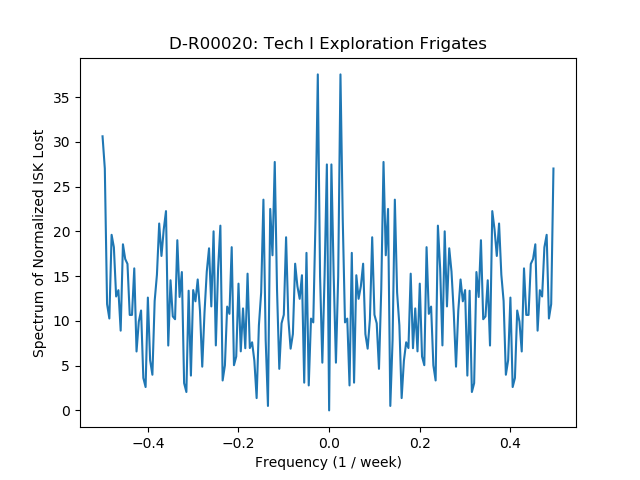
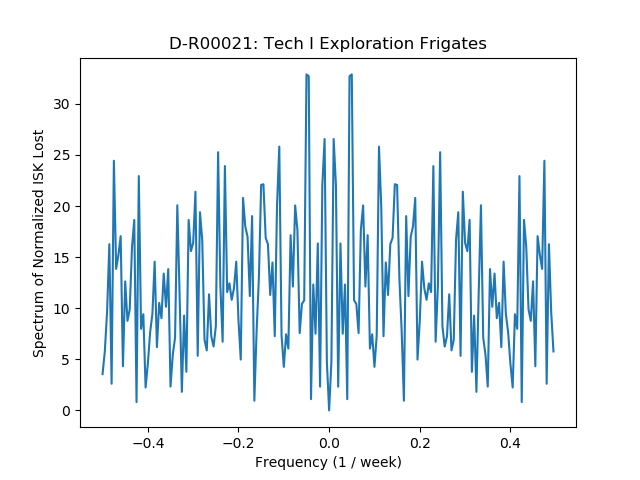
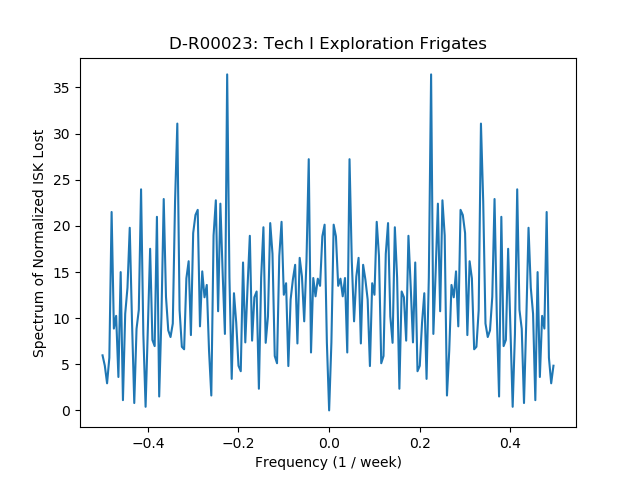
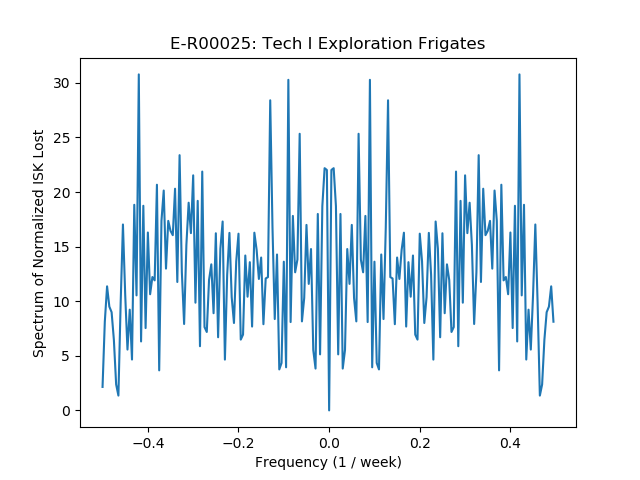
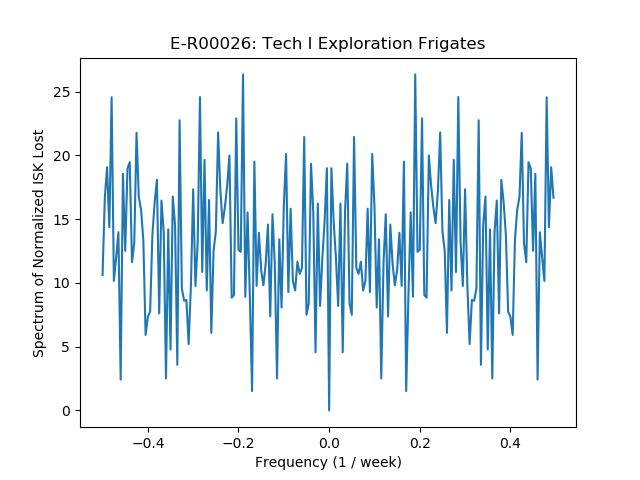
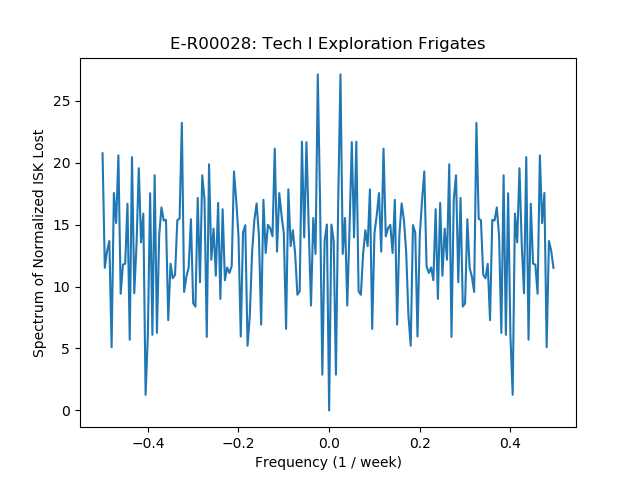
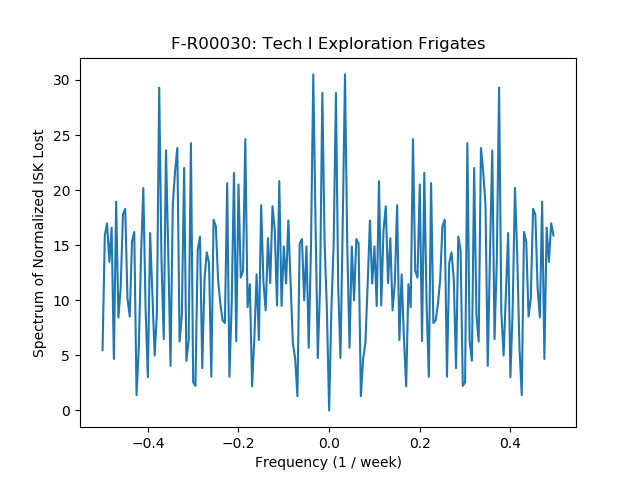
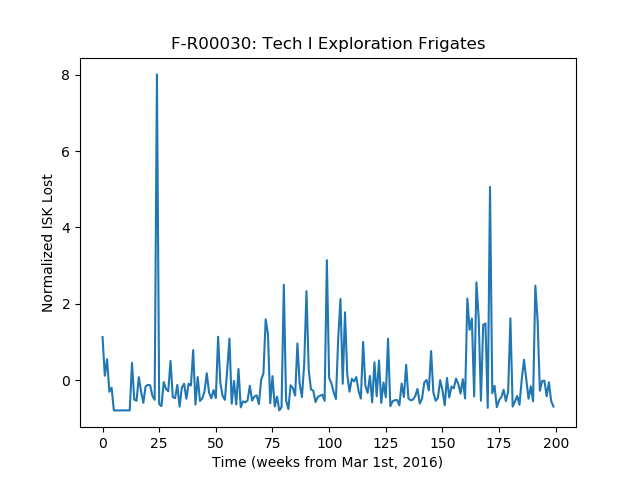
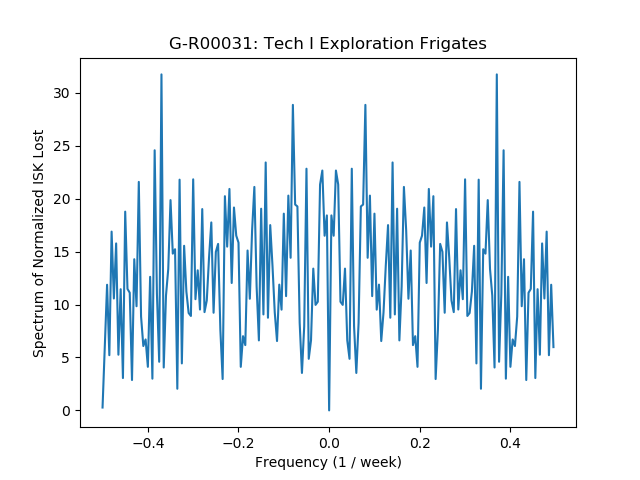
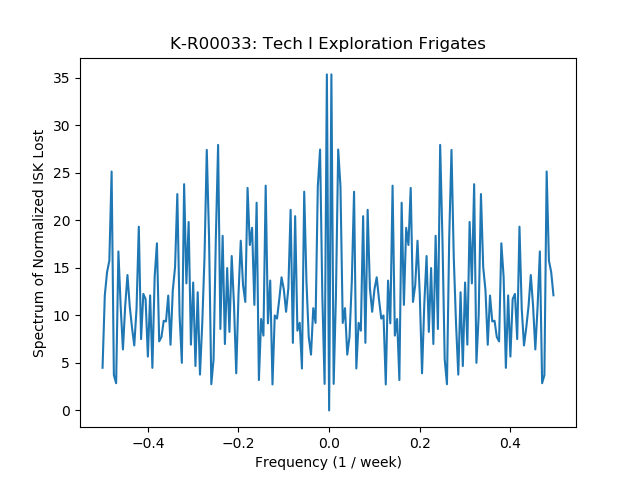
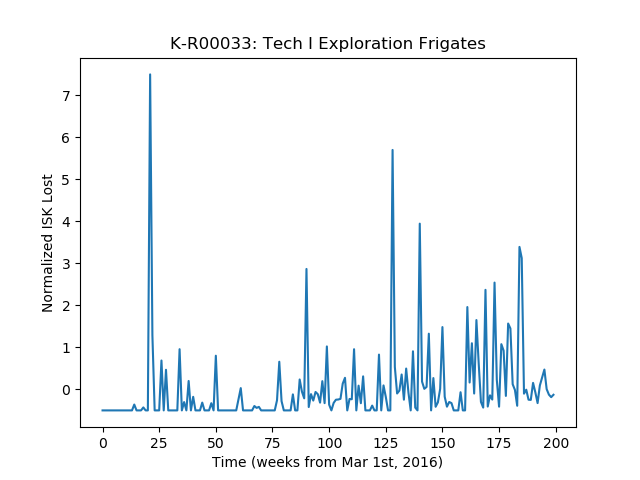
The spectrum shows periodic fluctuations in the amount of Isk lost by T1 exploration frigates.

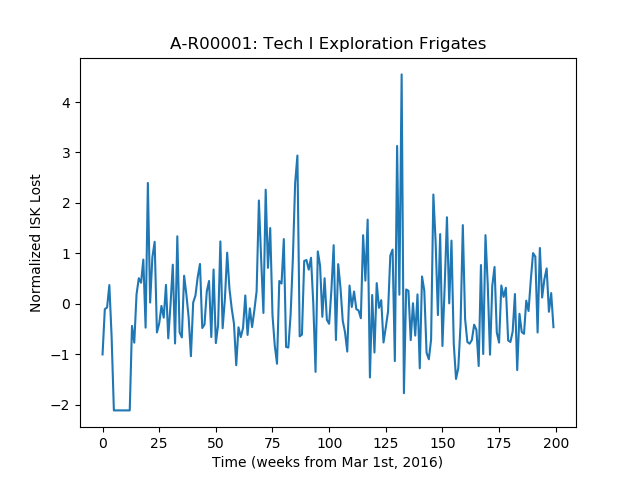
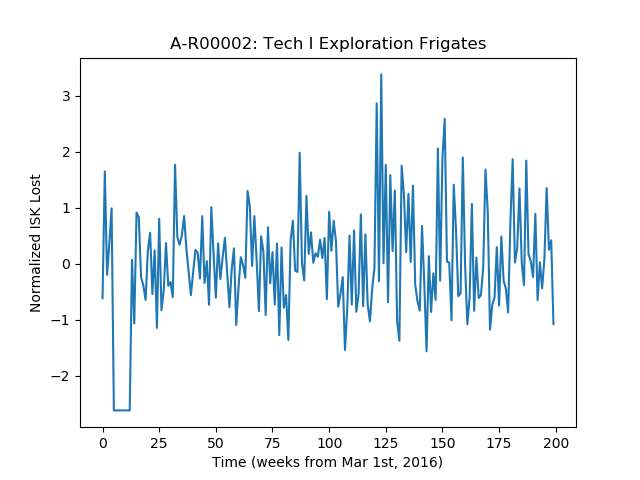
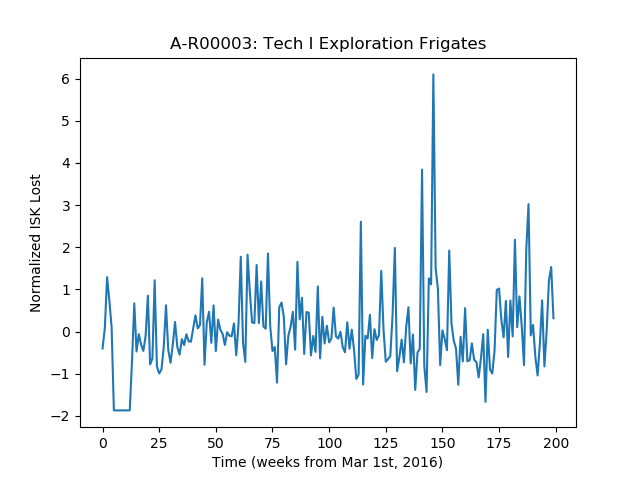
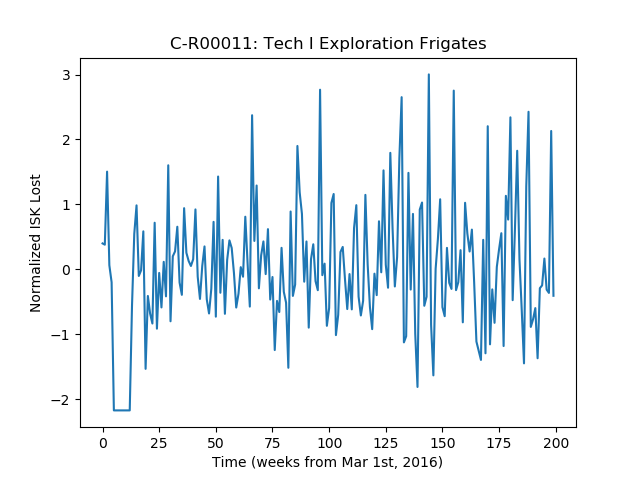
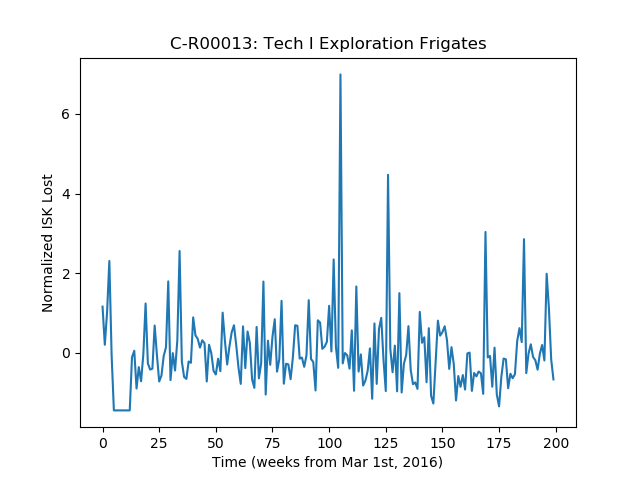
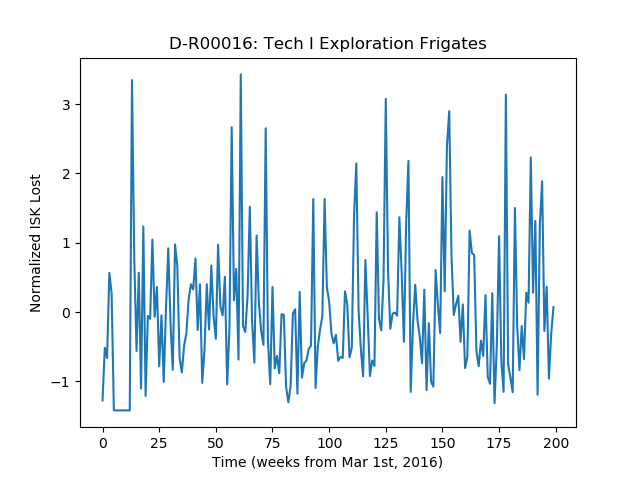
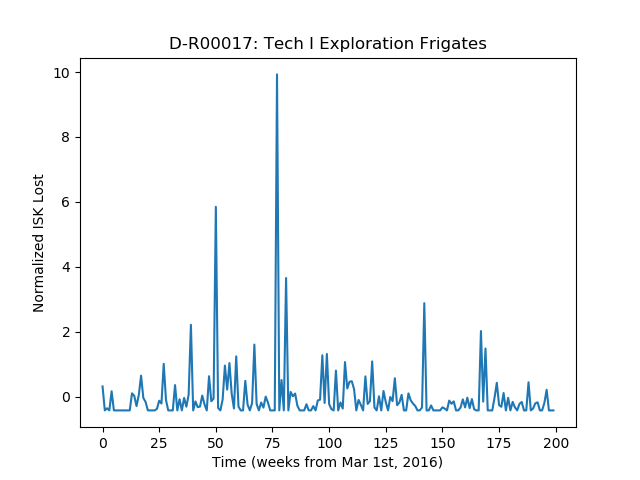
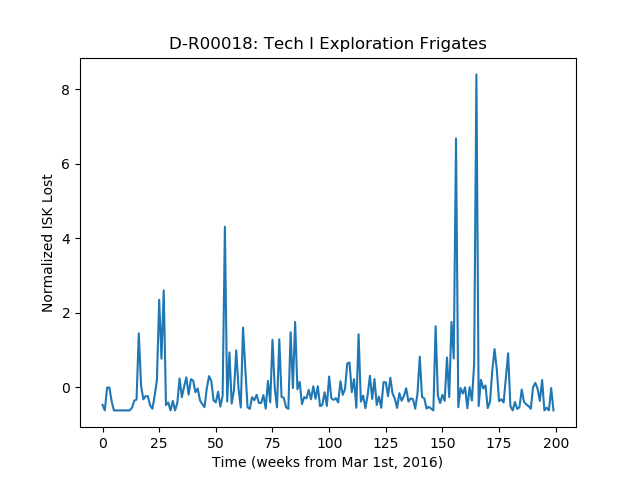
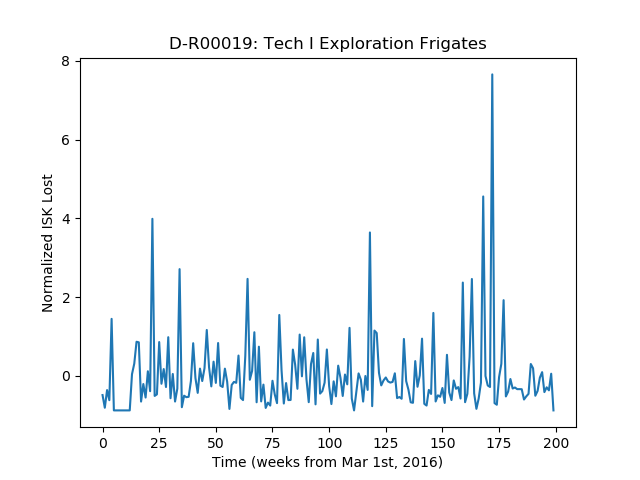
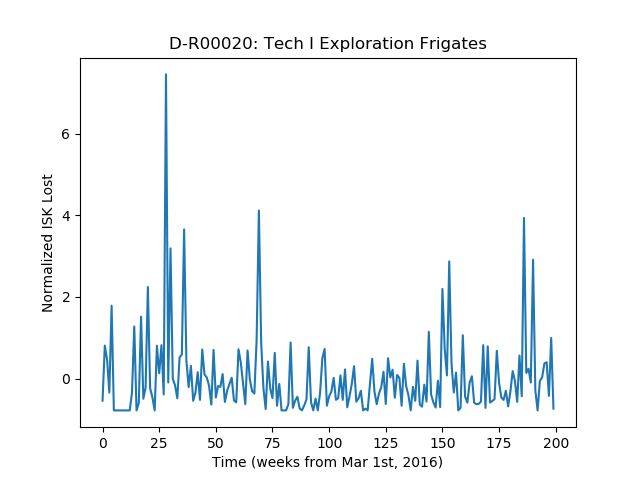
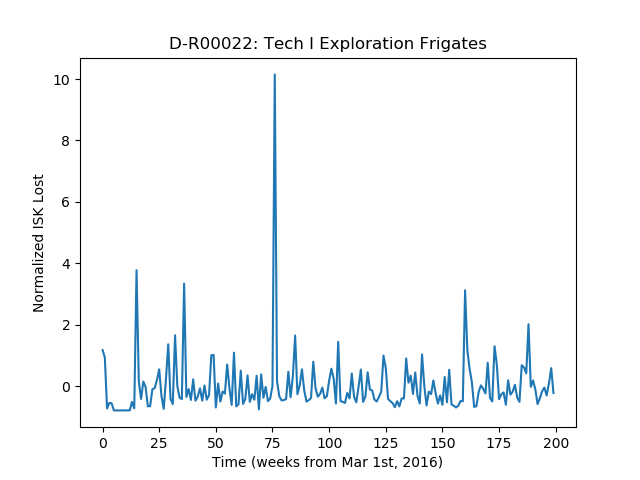
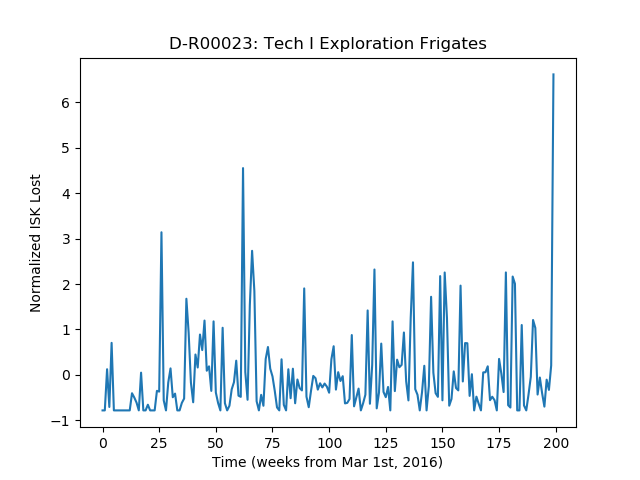
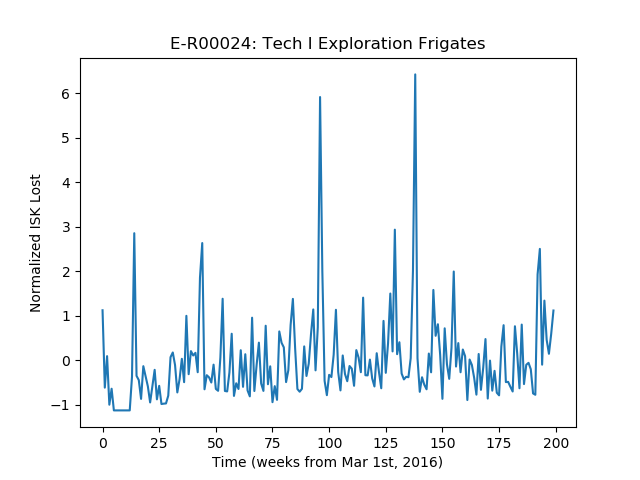
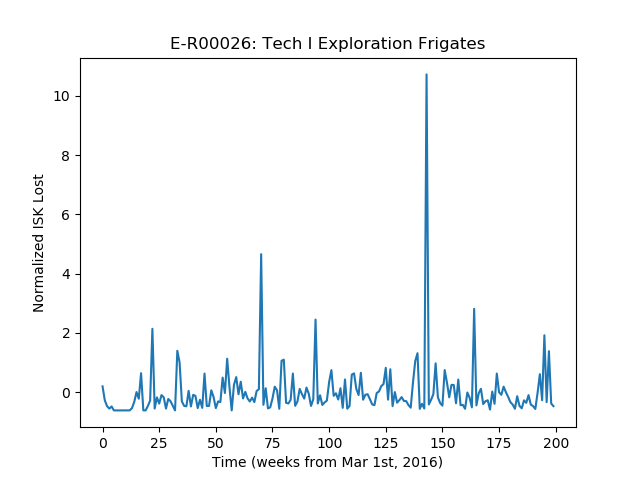
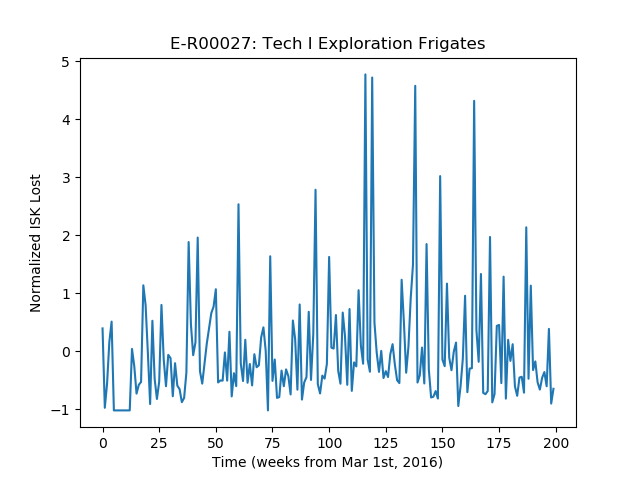
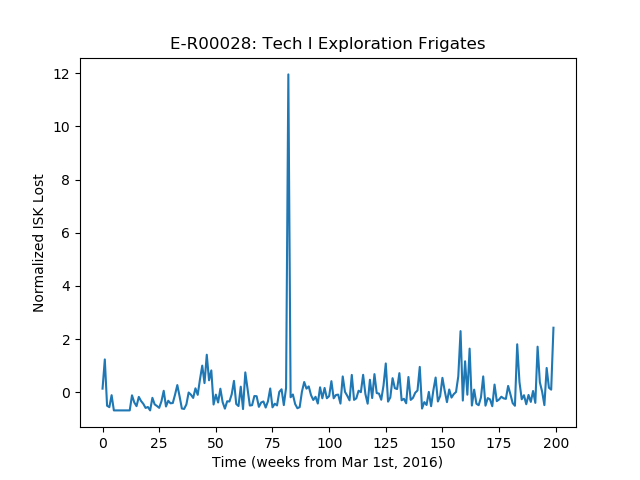
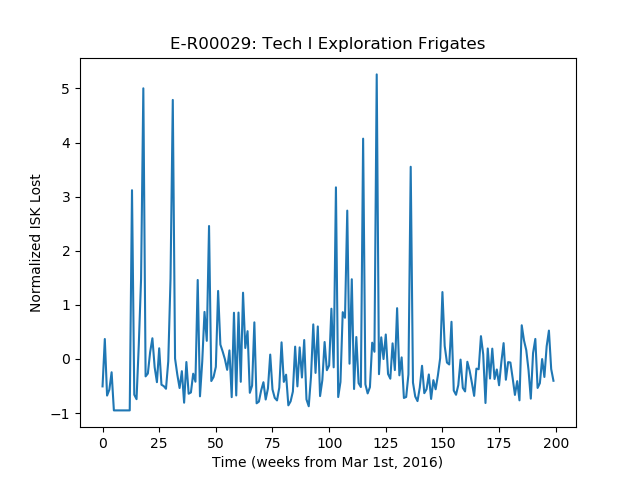
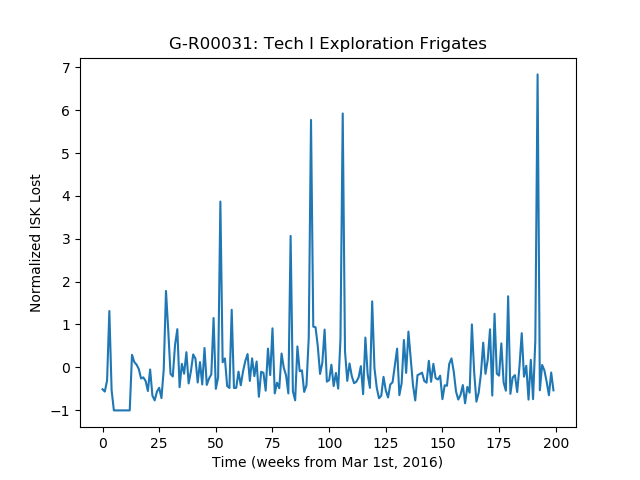
The time series shows the normalized Isk lost over time.
Regional Averages
Big table of graphs for each wormhole region
Details
- For every week, I calculate the normalized Isk lost in a region with two steps:
- I calculate (raw isk lost) = (Isk lost in this worm hole region) / [(#Ship killed in this region) * (Isk lost all the worm hole regions) ]
This should remove the effect of inflation and account for the regional differences of the amount of ships killed. - Standardize the (raw isk lost) over all weeks. I subtract the average over time from all the (raw isk lost). Then I divide the result by the standard deviation.
This would make all the spectra for all regions have similar magnitudes.
- I calculate (raw isk lost) = (Isk lost in this worm hole region) / [(#Ship killed in this region) * (Isk lost all the worm hole regions) ]
- The average of regional average is: average of normalized Isk lost over all regions.
Notice that this give all regions equal importance. The regions don’t have the same number of systems. - The data is from the monthly economic reports and a kill dump for March, 2016.
- I group kills every 7 days to remove the strong weekly cycle.